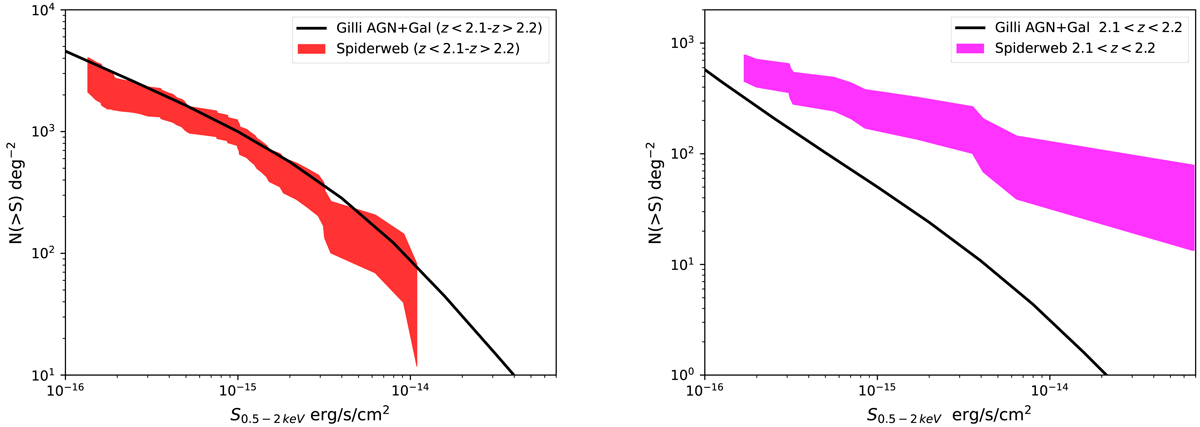
Fig. 11.
Download original image
Soft-band cumulative number counts in different redshift ranges. Left panel: soft-band log Nlog S in the Spiderweb field (within a radius of 5 arcmin) after excluding the X-ray sources identified in the 2.11 < z < 2.20 range compared to the expectations from the model of Gilli et al. (2007) in the same redshift range. The shaded area corresponds to an uncertainty of 1σ. Right panel: soft-band log Nlog S in the Spiderweb field only for the redshift interval 2.11 < z < 2.20 compared to the expectations from the model of Gilli et al. (2007) in the same redshift range. The shaded area corresponds to an uncertainty of 1σ. We note the different scales between the two panels.
Current usage metrics show cumulative count of Article Views (full-text article views including HTML views, PDF and ePub downloads, according to the available data) and Abstracts Views on Vision4Press platform.
Data correspond to usage on the plateform after 2015. The current usage metrics is available 48-96 hours after online publication and is updated daily on week days.
Initial download of the metrics may take a while.