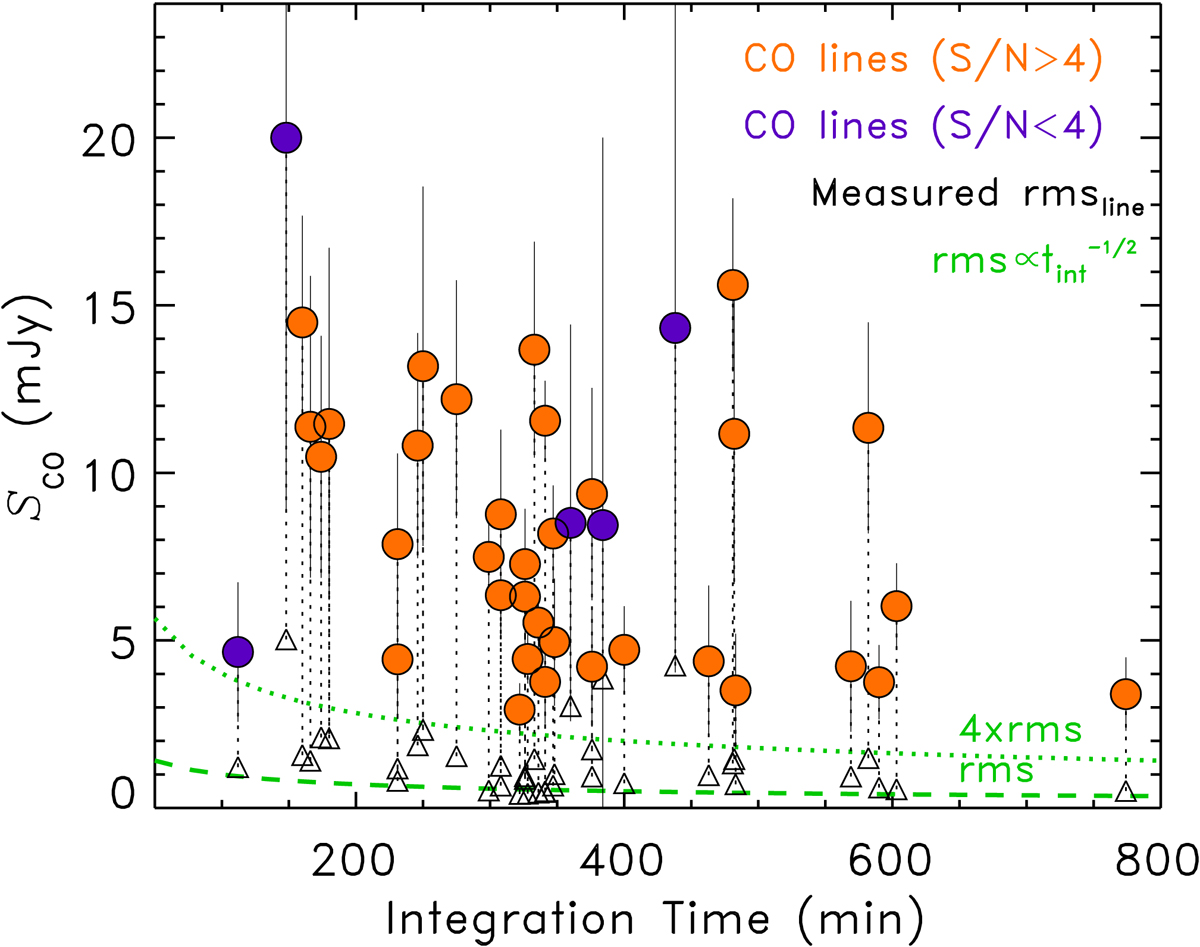
Fig. 7.
Download original image
Peak flux of the detected CO lines (full orange circles if S/N > 4.0, and purple if S/N ≤ 4.0) as a function of the integration time. The line rms is also shown (black triangles) and connected to the corresponding measured flux by a dotted vertical line. The expected trend of rmsline with the integration time is shown as dashed green line and the detection threshold of 4 × rmsline as dotted green line. The rmsline varies with channel width and depends on the line width.
Current usage metrics show cumulative count of Article Views (full-text article views including HTML views, PDF and ePub downloads, according to the available data) and Abstracts Views on Vision4Press platform.
Data correspond to usage on the plateform after 2015. The current usage metrics is available 48-96 hours after online publication and is updated daily on week days.
Initial download of the metrics may take a while.