Free Access
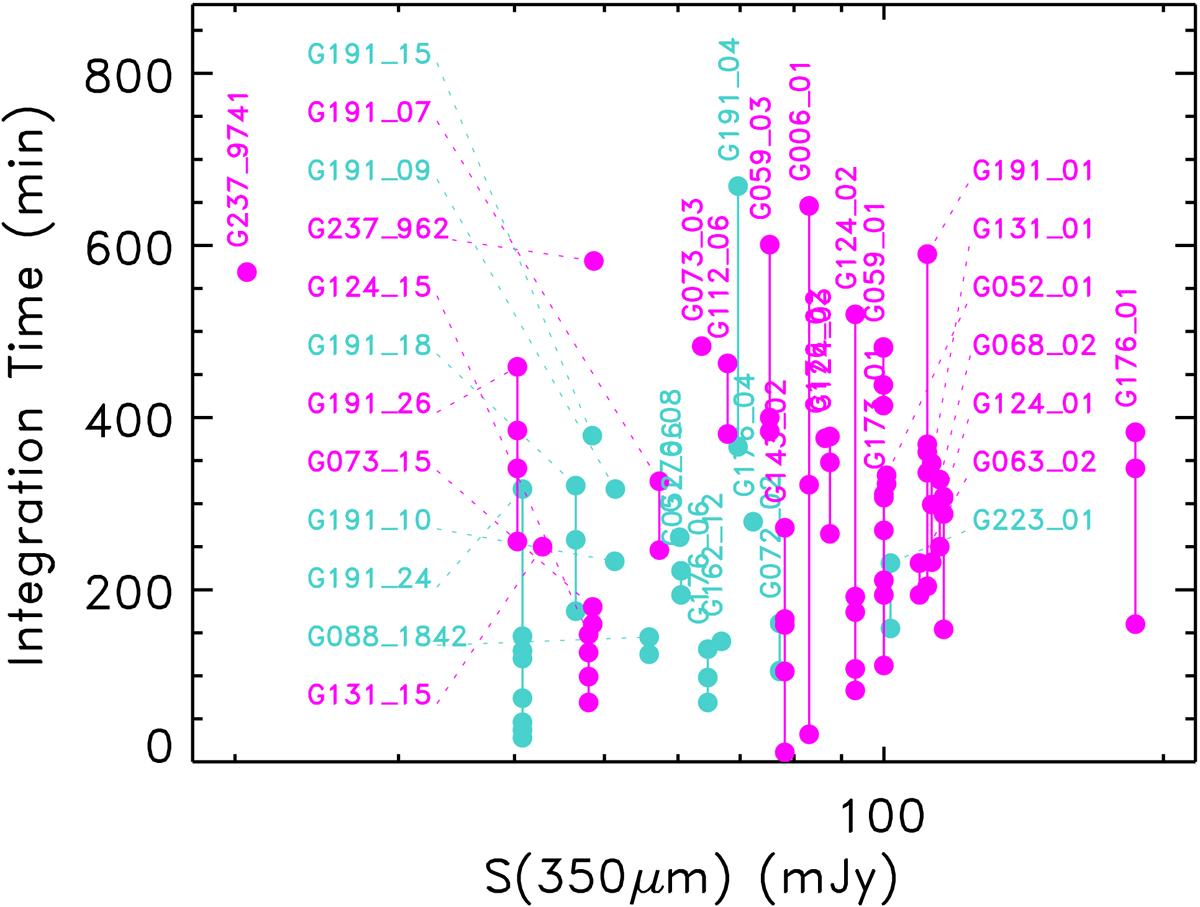
Fig. 6.
Download original image
EMIR integration time of all observations per source (full circle connected by a straight line) as a function of the source flux density at 350 μm. The source ID is noted. The observations that yielded at least one CO line detection are shown in magenta and those with no detections are shown in turquoise.
Current usage metrics show cumulative count of Article Views (full-text article views including HTML views, PDF and ePub downloads, according to the available data) and Abstracts Views on Vision4Press platform.
Data correspond to usage on the plateform after 2015. The current usage metrics is available 48-96 hours after online publication and is updated daily on week days.
Initial download of the metrics may take a while.