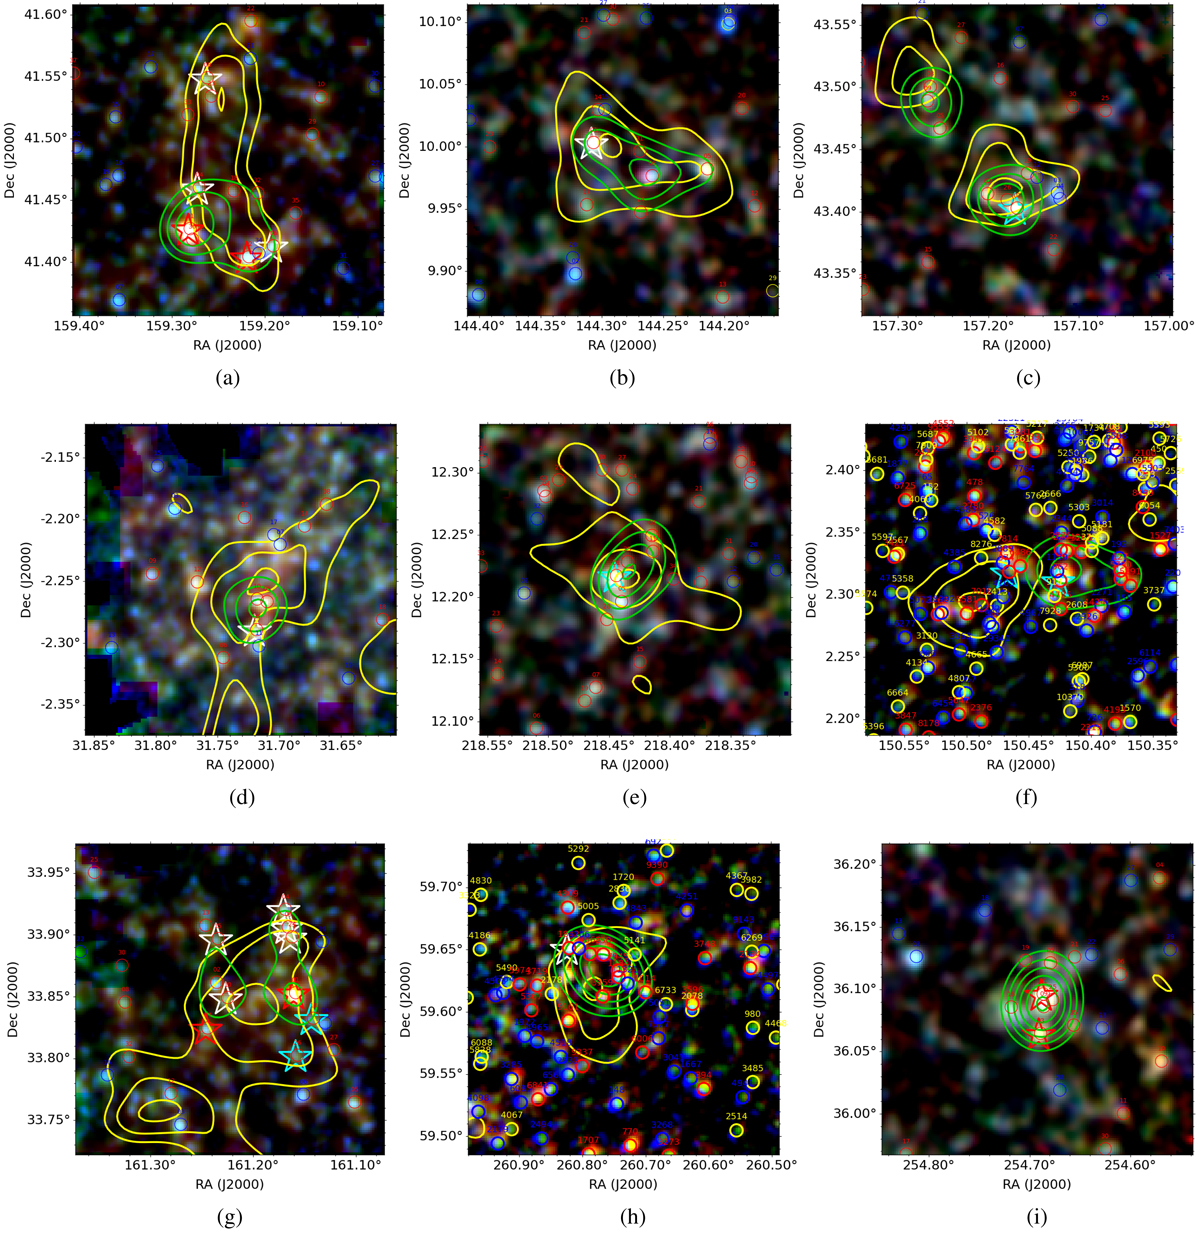
Fig. 4.
Download original image
15′×15′ Herschel RGB (red: 500 μm, green: 350 μm, blue: 250 μm) maps centered on the IRAM observed PHz fields presented here. SPIRE sources are indicated with open circles (red: red submm colors; blue: blue submm colors; yellow: not detected in all three bands, thus preventing a color classification). IRAM targets are indicated with big stars (red: CO detection at similar redshift (i.e., Δz/(1 + z) < 0.02), cyan: CO detected, there is only one detection or multiple detections at different redshifts (i.e., Δz/(1 + z) > 0.02); white: CO not detected). Yellow contours represent the Planck red-excess emission (50%, 70%, and 90% of the maximum value). Green contours represent the overdensity significance of red SPIRE sources (starting at 3σ, with steps of 1σ). (a) G176. (b) G223. (c) G173. (d) G162. (e) G006. (f) G237. (g) G191. (h) G088. (i) G059.
Current usage metrics show cumulative count of Article Views (full-text article views including HTML views, PDF and ePub downloads, according to the available data) and Abstracts Views on Vision4Press platform.
Data correspond to usage on the plateform after 2015. The current usage metrics is available 48-96 hours after online publication and is updated daily on week days.
Initial download of the metrics may take a while.