Free Access
Fig. B.3.
Download original image
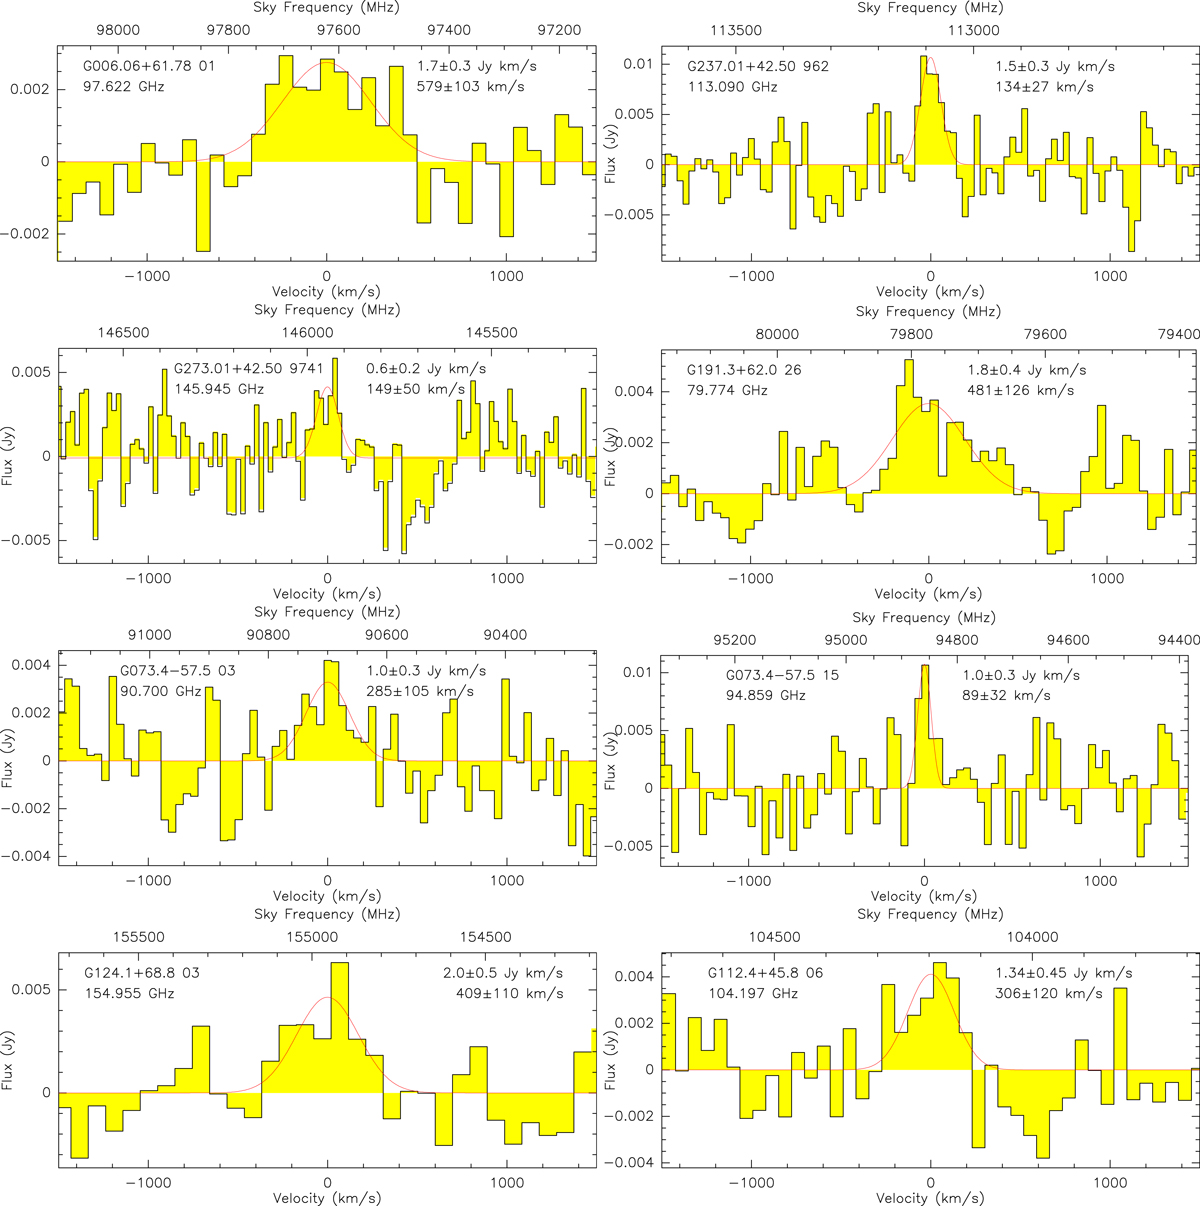
Emission line detections in the continum-subtracted EMIR spectra of the PHz-IRAM sources where a single CO line has been detected. The Gaussian fit to each line is overlaid with a red curve. Source name, line observed central frequency, intensity, and width are annotated in each panel.
Current usage metrics show cumulative count of Article Views (full-text article views including HTML views, PDF and ePub downloads, according to the available data) and Abstracts Views on Vision4Press platform.
Data correspond to usage on the plateform after 2015. The current usage metrics is available 48-96 hours after online publication and is updated daily on week days.
Initial download of the metrics may take a while.