Fig. 20.
Download original image
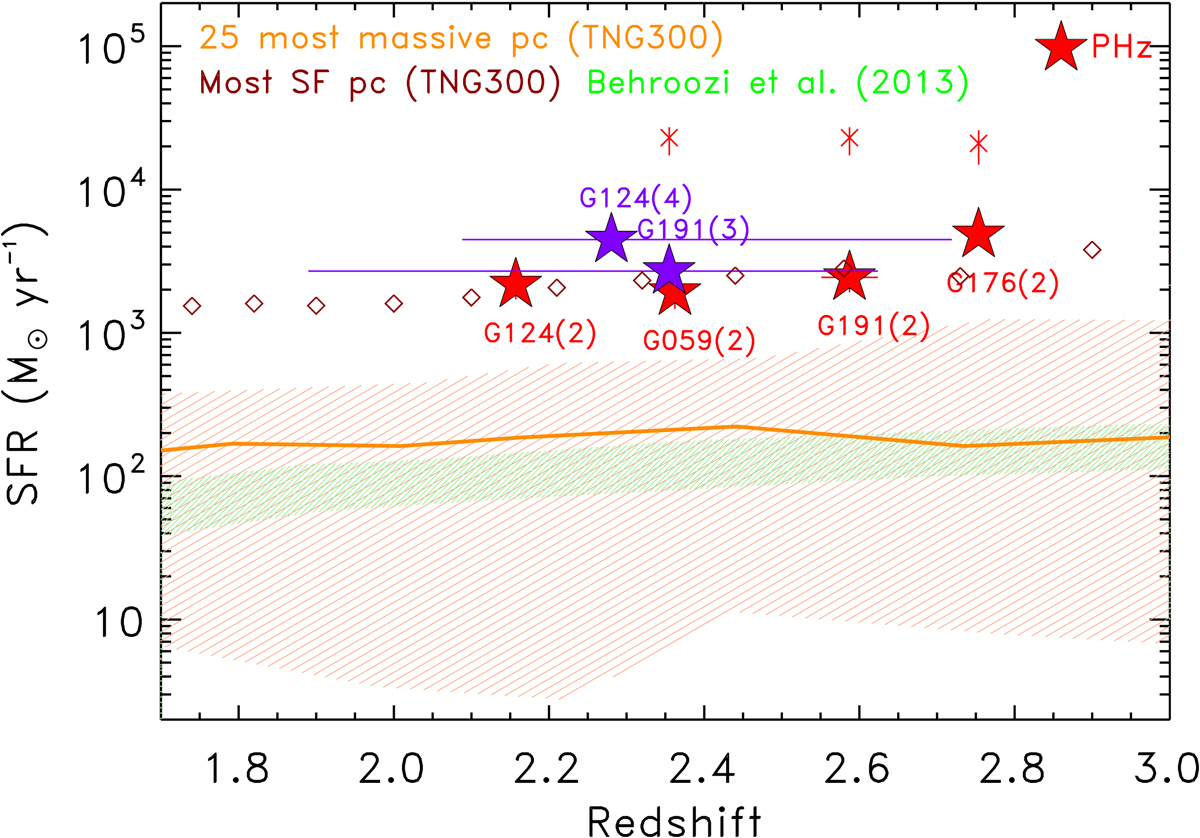
Total SFR as a function of redshift of the PHz fields with multiple CO-detected sources at the same redshift (red full stars), and at all redshifts (purple full stars) compared with the total SFRs of simulated protoclusters. Horizontal bars represent the range of redshifts of all sources considered for the computation of the total SFR (see number in parenthesis). The PHz field names are annotated. The total SFR derived from the Planck fluxes and assuming a dust temperature of 30 K are shown as red crosses (these are available only for the subset of fields that are in the official PHz list). The predictions from the empirical models of Behroozi et al. (2013) are shown as green hatched region, those from the protocluster that would become the 25 most massive z = 0 clusters in the TNG300 simulation as salmon hatched area, the median SFR of the five most massive TNG300 simulated clusters as salmon thick line (adapted from Lim et al. 2021), and the most star-forming protocluster at 1.3 ≤ z ≤ 3 from the TNG300 simulations as brown open diamonds (Gouin et al. 2022; Nelson et al. 2019).
Current usage metrics show cumulative count of Article Views (full-text article views including HTML views, PDF and ePub downloads, according to the available data) and Abstracts Views on Vision4Press platform.
Data correspond to usage on the plateform after 2015. The current usage metrics is available 48-96 hours after online publication and is updated daily on week days.
Initial download of the metrics may take a while.