Fig. 19.
Download original image
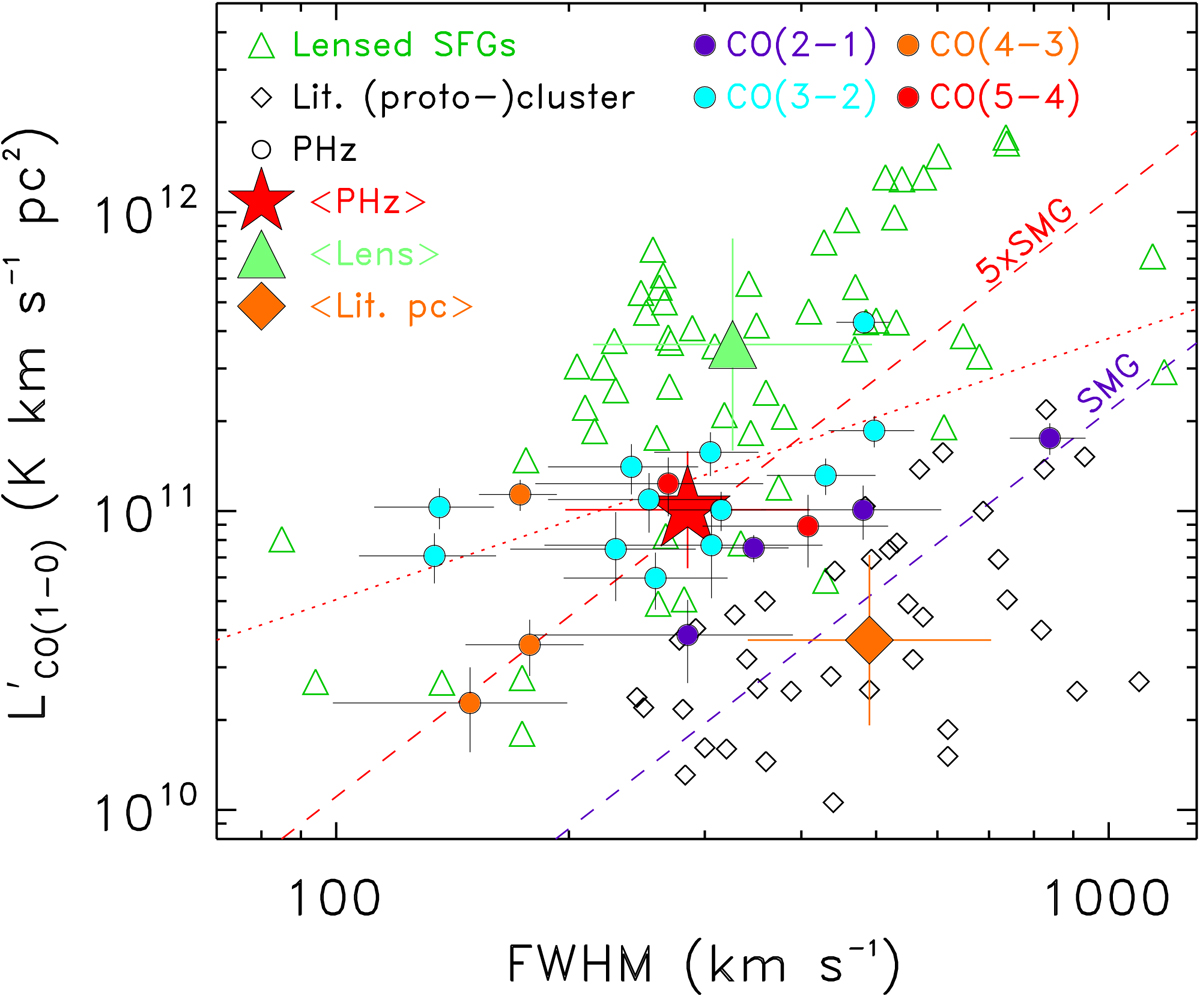
![]() as a function of FWHM derived from the lowest transition of each PHz-IRAM source with secure redshift (full circles: purple for CO(2−1), cyan for CO(3−2), orange for CO(4−3), and red for CO(5−4)). The large red star represents the median value of all PHz-IRAM sources. Black diamonds represent CO-detected cluster and protocluster galaxies at 1.4 < z < 3.1 and log(LIR/L⊙) > 11.44 + 0.5 × z from the literature, and the large filled orange diamond the corresponding median value. Green open triangles represent the observed values for lensed SFGs at 1.4 < z < 3.1 (Harris et al. 2012; Saintonge et al. 2013; Dessauges-Zavadsky et al. 2015; Cañameras et al. 2015; Aravena et al. 2016; Yang et al. 2017; Harrington et al. 2018; Solimano et al. 2021) and the large full green triangle the corresponding median value. The dashed purple line is the best-fit relation for unlensed high-z SMGs from Bothwell et al. (2013), and the red dashed line is the same relation but multiplied by a factor of 5 to match the PHz-IRAM median value. The dotted red line is the best linear fit to the PHz-IRAM values.
as a function of FWHM derived from the lowest transition of each PHz-IRAM source with secure redshift (full circles: purple for CO(2−1), cyan for CO(3−2), orange for CO(4−3), and red for CO(5−4)). The large red star represents the median value of all PHz-IRAM sources. Black diamonds represent CO-detected cluster and protocluster galaxies at 1.4 < z < 3.1 and log(LIR/L⊙) > 11.44 + 0.5 × z from the literature, and the large filled orange diamond the corresponding median value. Green open triangles represent the observed values for lensed SFGs at 1.4 < z < 3.1 (Harris et al. 2012; Saintonge et al. 2013; Dessauges-Zavadsky et al. 2015; Cañameras et al. 2015; Aravena et al. 2016; Yang et al. 2017; Harrington et al. 2018; Solimano et al. 2021) and the large full green triangle the corresponding median value. The dashed purple line is the best-fit relation for unlensed high-z SMGs from Bothwell et al. (2013), and the red dashed line is the same relation but multiplied by a factor of 5 to match the PHz-IRAM median value. The dotted red line is the best linear fit to the PHz-IRAM values.
Current usage metrics show cumulative count of Article Views (full-text article views including HTML views, PDF and ePub downloads, according to the available data) and Abstracts Views on Vision4Press platform.
Data correspond to usage on the plateform after 2015. The current usage metrics is available 48-96 hours after online publication and is updated daily on week days.
Initial download of the metrics may take a while.