Fig. 14.
Download original image
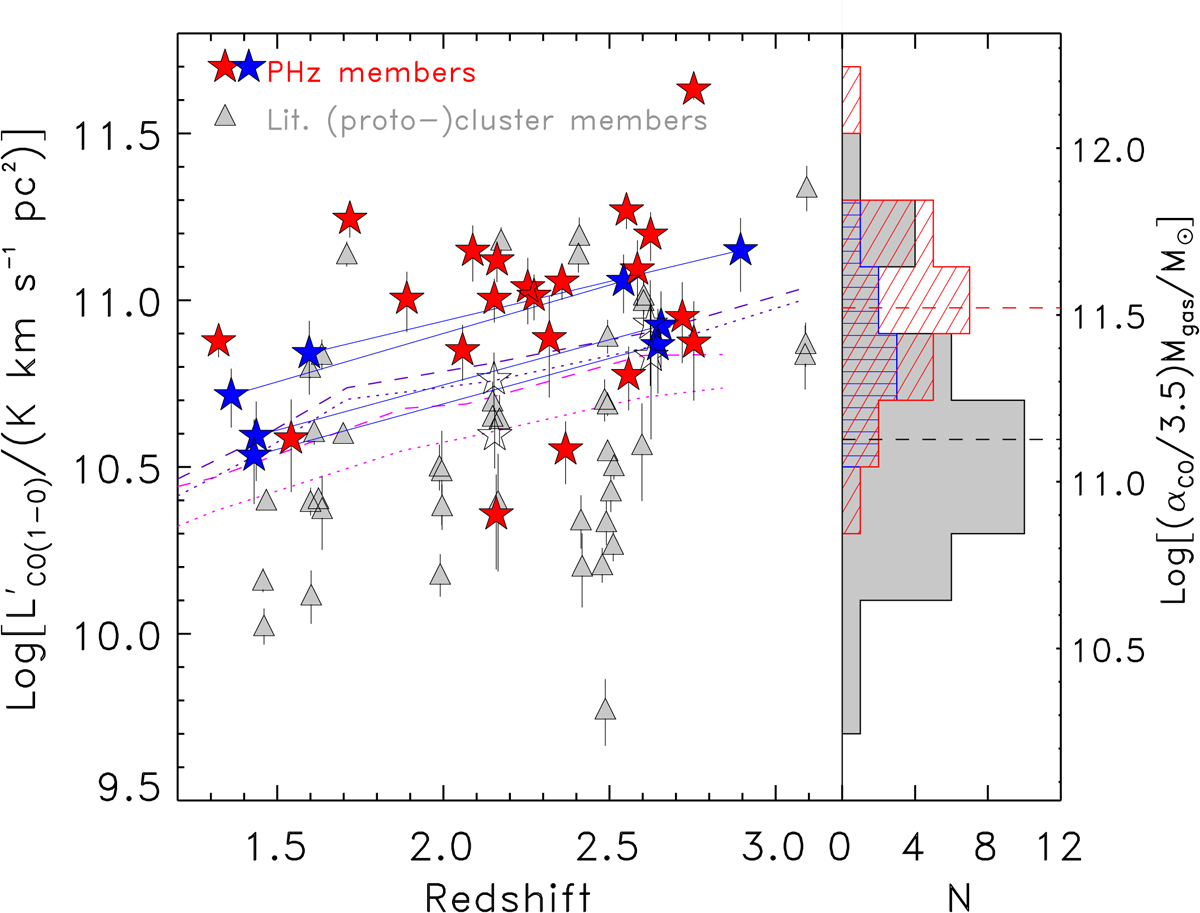
CO(1−0) luminosity as a function of redshift for the PHz-IRAM sources. Symbols are the same as in Fig. 10. The purple and magenta curves show the expected ![]() rms at, respectively, 3 mm (E090), and 2 mm (E150) reached in 5 h of integration time in the summer (dashed curve) and in the winter (dotted curve) semesters, assuming average conditions, and a resolution of 45 km s−1. Right panel: CO luminosity distributions for the same samples shown in the main panel. Horizontal dashed lines represent the mean luminosities for the PHz-IRAM sources with secure line identifications (red), and for the literature sources (black). The vertical y-axis on the right hand-side shows the molecular gas masses derived from the CO(1−0) luminosity assuming αCO = 3.5.
rms at, respectively, 3 mm (E090), and 2 mm (E150) reached in 5 h of integration time in the summer (dashed curve) and in the winter (dotted curve) semesters, assuming average conditions, and a resolution of 45 km s−1. Right panel: CO luminosity distributions for the same samples shown in the main panel. Horizontal dashed lines represent the mean luminosities for the PHz-IRAM sources with secure line identifications (red), and for the literature sources (black). The vertical y-axis on the right hand-side shows the molecular gas masses derived from the CO(1−0) luminosity assuming αCO = 3.5.
Current usage metrics show cumulative count of Article Views (full-text article views including HTML views, PDF and ePub downloads, according to the available data) and Abstracts Views on Vision4Press platform.
Data correspond to usage on the plateform after 2015. The current usage metrics is available 48-96 hours after online publication and is updated daily on week days.
Initial download of the metrics may take a while.