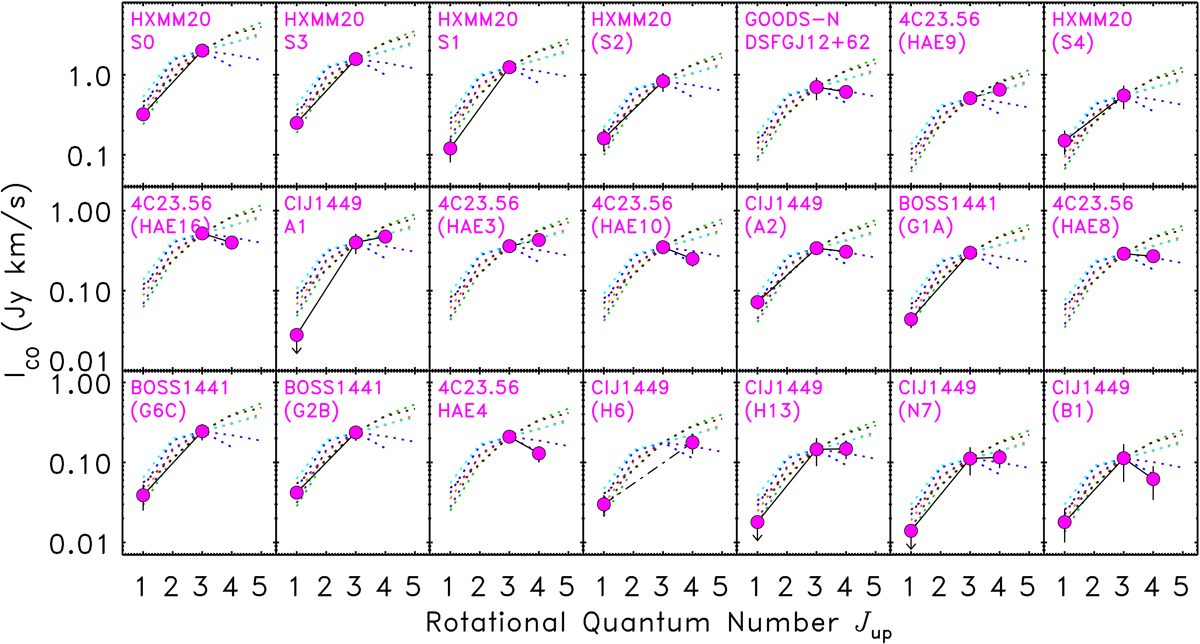
Fig. 13.
Download original image
CO SLEDs of protocluster members from the literature (full pink circles connected by black lines; Coogan et al. 2018; Casey 2016; Lee et al. 2017, 2019; Gómez-Guijarro et al. 2019) compared with the CO SLED of different types or sources (dotted lines of color as in Fig. 12). Downward pointing arrows indicate upper limits. The protocluster and source names are annotated (see Table C.1). Source names between parentheses are those that do not satisfy the IR luminosity selection criterion.
Current usage metrics show cumulative count of Article Views (full-text article views including HTML views, PDF and ePub downloads, according to the available data) and Abstracts Views on Vision4Press platform.
Data correspond to usage on the plateform after 2015. The current usage metrics is available 48-96 hours after online publication and is updated daily on week days.
Initial download of the metrics may take a while.