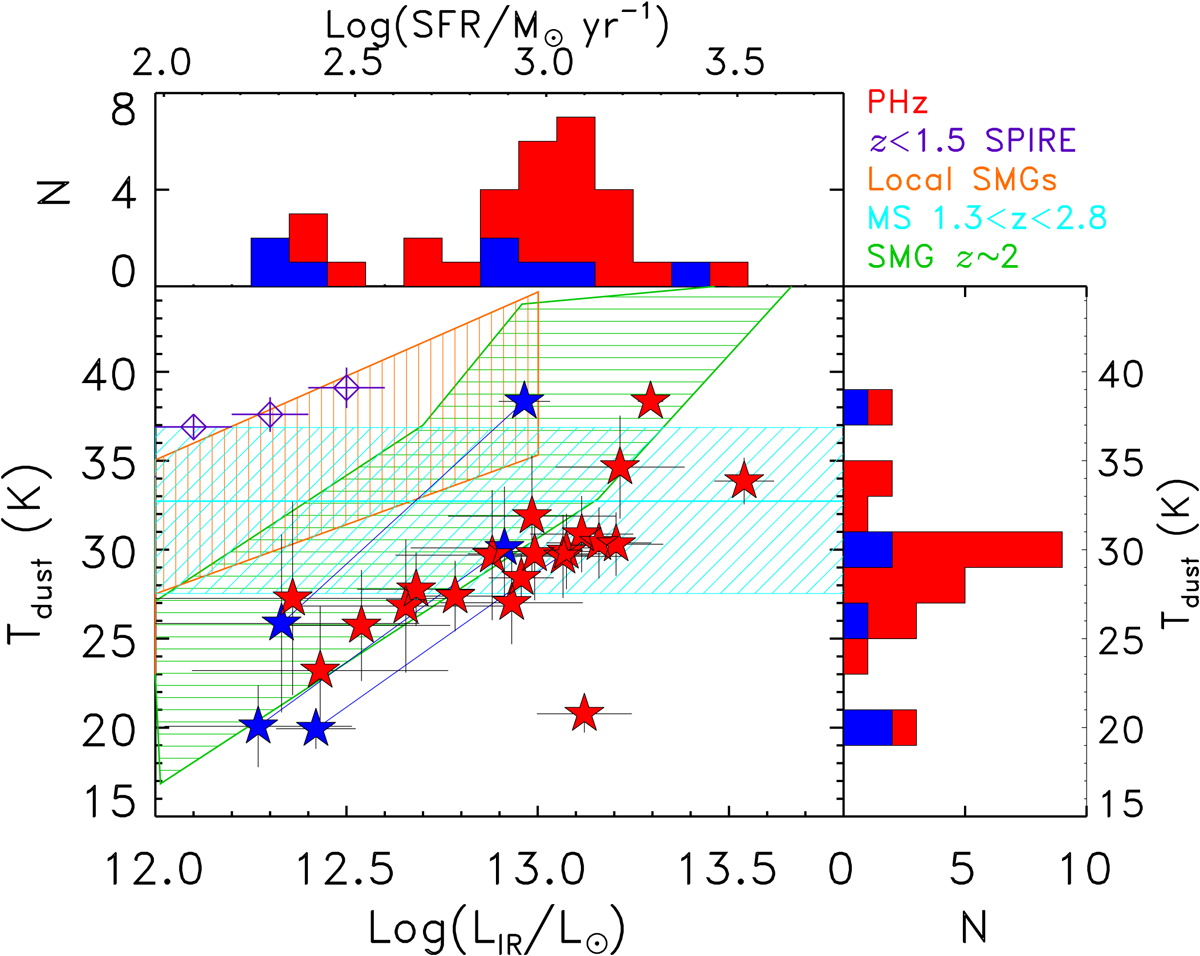
Fig. 11.
Download original image
Main panel: dust temperature as a function of the IR (8−1000 μm) luminosity for the PHz-IRAM sources (full stars, red for secure CO line identifications, and blue for the uncertain ones). The shaded orange area shows the local Tdust − LIR relation derived by Chapman et al. (2003), linearly extrapolated to 1013 L⊙. The shaded cyan area shows the range of dust temperatures for main sequence galaxies in the redshift range of the PHz-IRAM sources (1.3 < z < 2.8) according to the relation found by Magnelli et al. (2014), and extended to LIR > 1013 L⊙. The shaded green area presents results for z ≃ 2 SMGs from Chapman et al. (2005). The purple diamonds represent the relation found for z < 1.5 SPIRE sources by Symeonidis et al. (2013). Top and right panels: distributions of SFR (and IR luminosity) and dust temperature, respectively, for all PHz-IRAM sources.
Current usage metrics show cumulative count of Article Views (full-text article views including HTML views, PDF and ePub downloads, according to the available data) and Abstracts Views on Vision4Press platform.
Data correspond to usage on the plateform after 2015. The current usage metrics is available 48-96 hours after online publication and is updated daily on week days.
Initial download of the metrics may take a while.