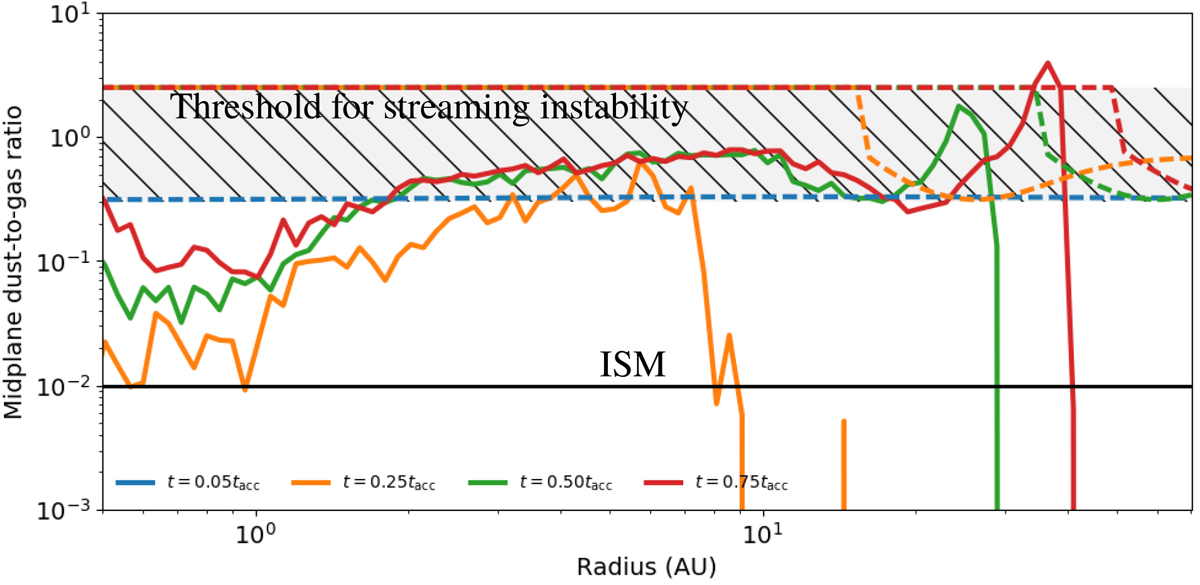
Fig. 9
Download original image
Midplane dust-to-gas ratios for the Std-med collapse model at the same time steps as shown in Fig. 8. At the earliest times (solid blue curve), the dust disk has yet to form and does not appear in this plot. The black line shows the ISM dust-to-gas ratio, which represents the initial conditions in the envelope, and the coloured dashed lines show the streaming instability threshold at each time step. The hashed region is an estimate of the streaming instability threshold based on Youdin & Goodman (2005), and the dashed lines show the threshold based on Li & Youdin (2021). The threshold is met along the midplane of the embedded disk only at the last time step.
Current usage metrics show cumulative count of Article Views (full-text article views including HTML views, PDF and ePub downloads, according to the available data) and Abstracts Views on Vision4Press platform.
Data correspond to usage on the plateform after 2015. The current usage metrics is available 48-96 hours after online publication and is updated daily on week days.
Initial download of the metrics may take a while.