Fig. 7
Download original image
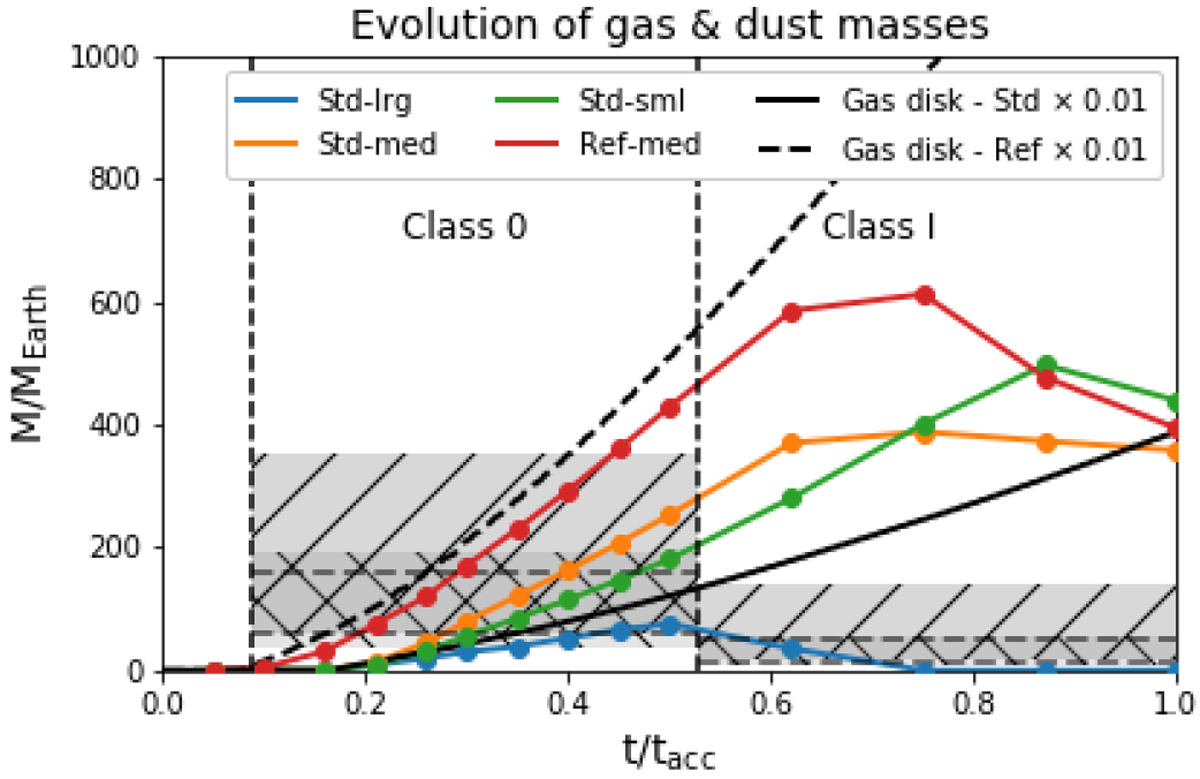
Time evolution of the total dust mass inside of the embedded disk in each model over one tacc (~252 kyr). The grey bands show the median disk masses for ALMA-detected (right hatch) and VLA-detected (left hatch) protostars reported by Tychoniec et al. (2020) along with the confidence interval of the median. The ALMA-inferred masses are likely lower limits because the dust is optically thick, while the VLA-inferred masses are more likely to be optically thin and use realistic opacities assuming the existence of large grains. The vertical dashed lines show the time at which the embedded disk first appears (classifying the system as class 0) and when the disk gas mass exceeds the remaining gas mass in the envelope (classifying the system as class I). Class 0 and class I objects were both included by Tychoniec et al. (2020), and we have separated them to compute individual medians and confidence intervals. For comparison, we include the mass evolution of the disk gas in the standard (solid black) and reference (dashed black) models, scaled by the ISM dust-to-gas ratio.
Current usage metrics show cumulative count of Article Views (full-text article views including HTML views, PDF and ePub downloads, according to the available data) and Abstracts Views on Vision4Press platform.
Data correspond to usage on the plateform after 2015. The current usage metrics is available 48-96 hours after online publication and is updated daily on week days.
Initial download of the metrics may take a while.