Fig. 2
Download original image
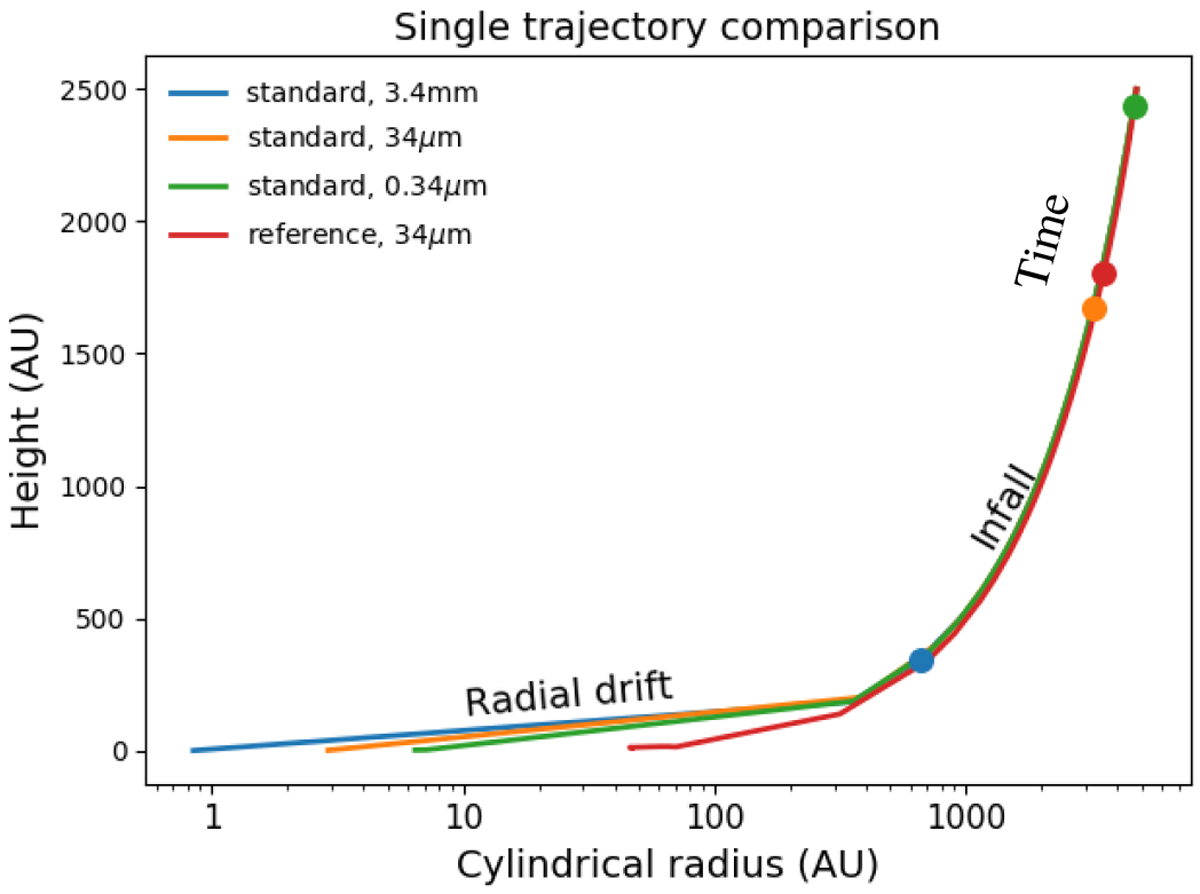
Single dust parcel trajectory starting from the same location in the envelope for all four models. Broadly speaking, time flows from the top right of the figure to the bottom left. The coloured point denotes the location of the parcel in each model at a collapse time of 120 kyr. The size of the dust particles in each collapse model denotes how quickly the dust collapses, with larger grains being farther along in their collapse than smaller grains. The different rotation rates of the clouds produces a small change in the envelope collapse, and the embedded disk grows more quickly, which causes a large change in the trajectory when the dust particle encounters the disk.
Current usage metrics show cumulative count of Article Views (full-text article views including HTML views, PDF and ePub downloads, according to the available data) and Abstracts Views on Vision4Press platform.
Data correspond to usage on the plateform after 2015. The current usage metrics is available 48-96 hours after online publication and is updated daily on week days.
Initial download of the metrics may take a while.