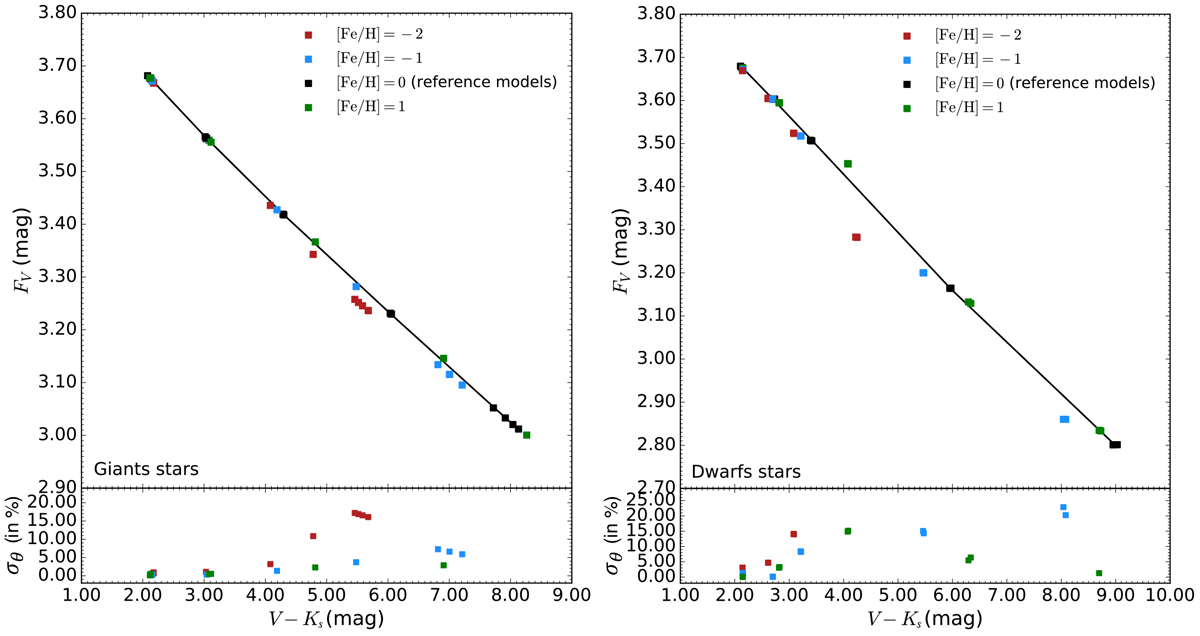
Fig. 3
Download original image
For giants (left) and dwarfs (right) the surface gravity log g varies with the effective temperature as shown in Table 1 (black squares), while all the parameter space of MARCS is explored regarding the microturbulence and the mass. Other colours (red, blue, and green squares) correspond to different metallicities. The bottom panels show the absolute value of the difference in the expected angular diameter between a given SBCR and the reference value (solid black line).
Current usage metrics show cumulative count of Article Views (full-text article views including HTML views, PDF and ePub downloads, according to the available data) and Abstracts Views on Vision4Press platform.
Data correspond to usage on the plateform after 2015. The current usage metrics is available 48-96 hours after online publication and is updated daily on week days.
Initial download of the metrics may take a while.