Fig. 9
Download original image
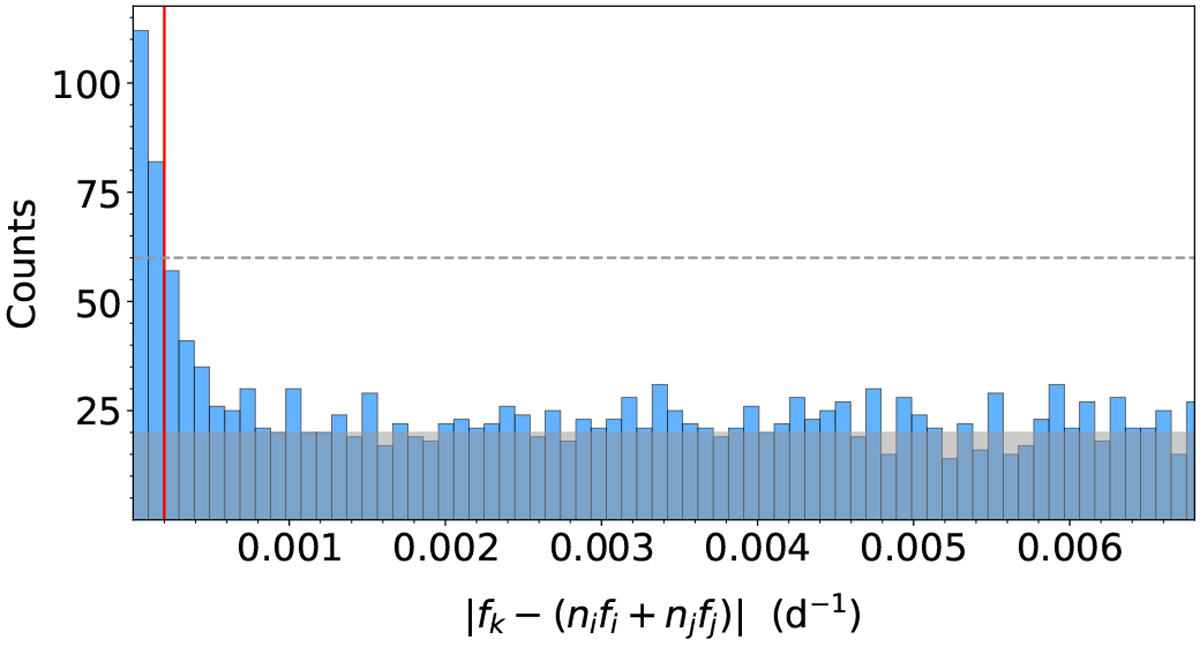
Histogram following Eq. (9) for the frequencies of stars in our g-mode sample. The gray shade marks the background level that represents a random match among combination frequencies and the horizontal dashed gray line marks 3 times that level. The vertical red shows the intercept of the dashed gray line and the distribution; it marks ε = 0.0002 according to Eq. (9). Frequencies occurring to the left of this line have a 67% probability of corresponding to a genuine combination frequency.
Current usage metrics show cumulative count of Article Views (full-text article views including HTML views, PDF and ePub downloads, according to the available data) and Abstracts Views on Vision4Press platform.
Data correspond to usage on the plateform after 2015. The current usage metrics is available 48-96 hours after online publication and is updated daily on week days.
Initial download of the metrics may take a while.