Fig. 5
Download original image
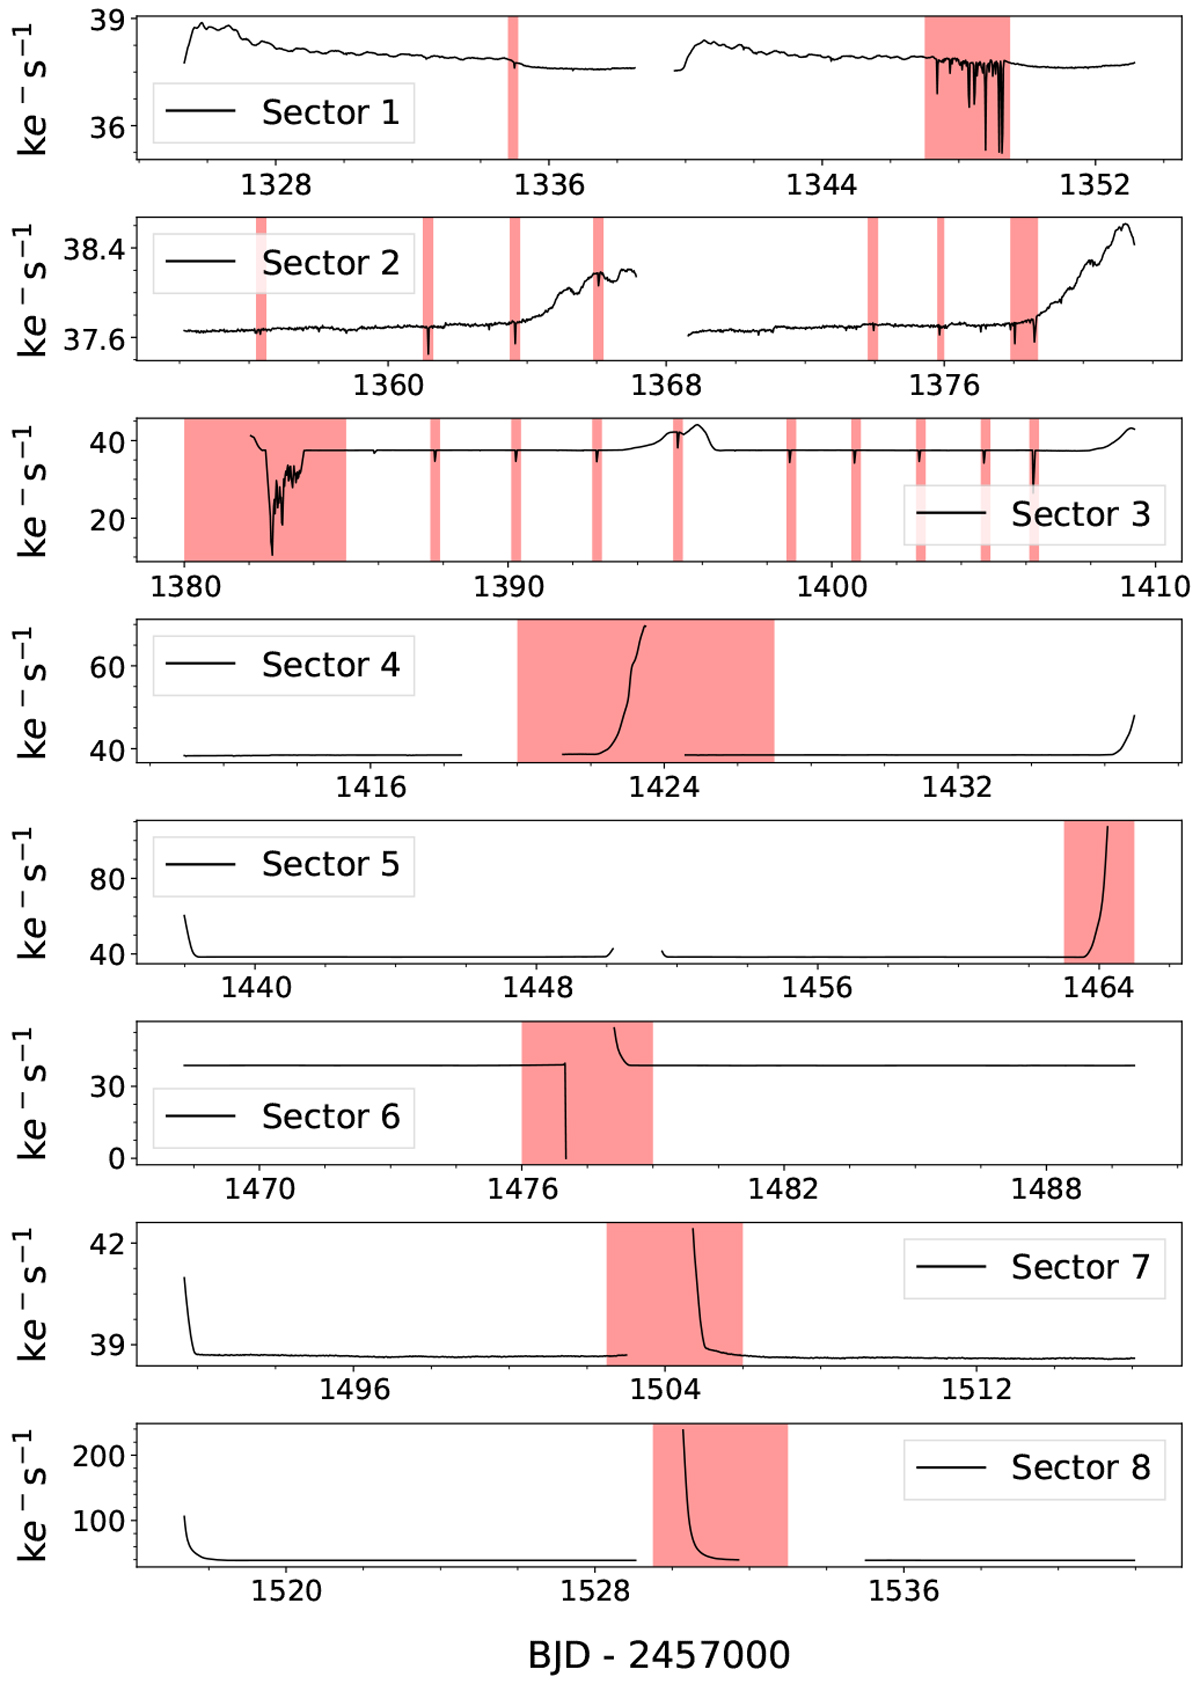
Uncorrected light curves of TIC 30192406, showing in red the time intervals that have been excluded for all stars according to Table A.1. Sector 1 shows an example of jittering of the satellite. Sector 2 shows an example of scattered sunlight reflected by the Earth or the Moon. Sector 3 shows an example of systematic flux variability caused by the periodic re-pointing of the camera.
Current usage metrics show cumulative count of Article Views (full-text article views including HTML views, PDF and ePub downloads, according to the available data) and Abstracts Views on Vision4Press platform.
Data correspond to usage on the plateform after 2015. The current usage metrics is available 48-96 hours after online publication and is updated daily on week days.
Initial download of the metrics may take a while.