Fig. 2
Download original image
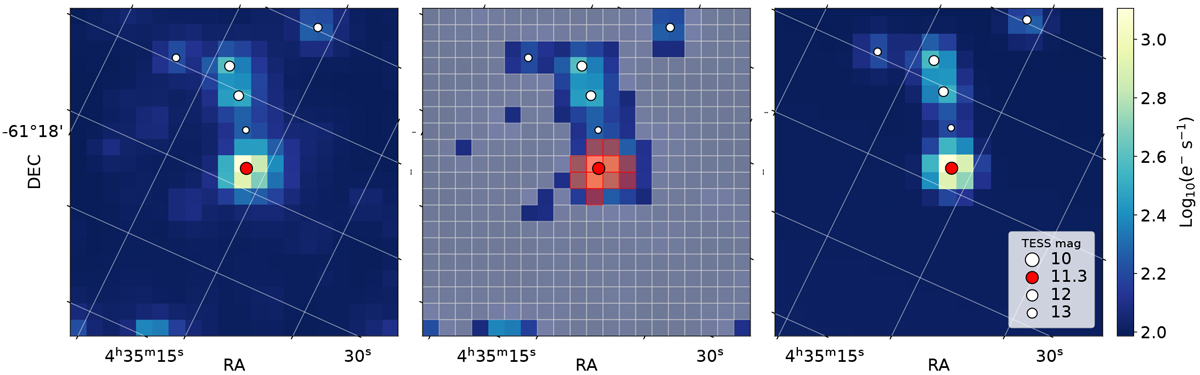
Square 20-by-20 pixels around TIC 38845463, TESS sector 1. The color bar is common to the three panels and shows a logarithmic scale of the flux in electrons per second. The red circle represents the target star while white circles indicate TIC neighboring stars down to four TESS magnitudes fainter with respect to the target star. The symbol sizes are inversely proportional to the TESS magnitude. Declination grids are 2′ apart. Left: median image of the target pixel file. Middle: panel with the final aperture mask (red shade) and background mask (gray shade) overplotted. The aperture mask results from the threshold parameter n = 20 (see text for explanation). Right: best fit based on the left panel used to estimate the level of contamination in the aperture mask due to flux from neighboring stars. The image was modeled as six 2D Gaussian functions plus a 2D plane. See Sect. 3.1 for further details.
Current usage metrics show cumulative count of Article Views (full-text article views including HTML views, PDF and ePub downloads, according to the available data) and Abstracts Views on Vision4Press platform.
Data correspond to usage on the plateform after 2015. The current usage metrics is available 48-96 hours after online publication and is updated daily on week days.
Initial download of the metrics may take a while.