Fig. 16
Download original image
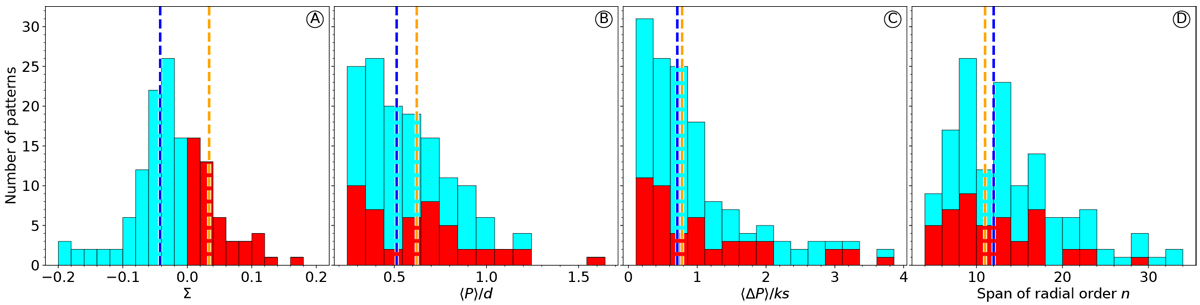
Characterization of the best-fit patterns in our sample. The stacked histograms show retrograde modes in red and prograde modes in cyan. The vertical orange and blue lines are the median of the retrograde and prograde distributions, respectively. (A): slope α = dΔP/dP. (B): mean period 〈p〉. (C): mean period spacing 〈Δp〉. (D): span of the overtones.
Current usage metrics show cumulative count of Article Views (full-text article views including HTML views, PDF and ePub downloads, according to the available data) and Abstracts Views on Vision4Press platform.
Data correspond to usage on the plateform after 2015. The current usage metrics is available 48-96 hours after online publication and is updated daily on week days.
Initial download of the metrics may take a while.