Fig. 11
Download original image
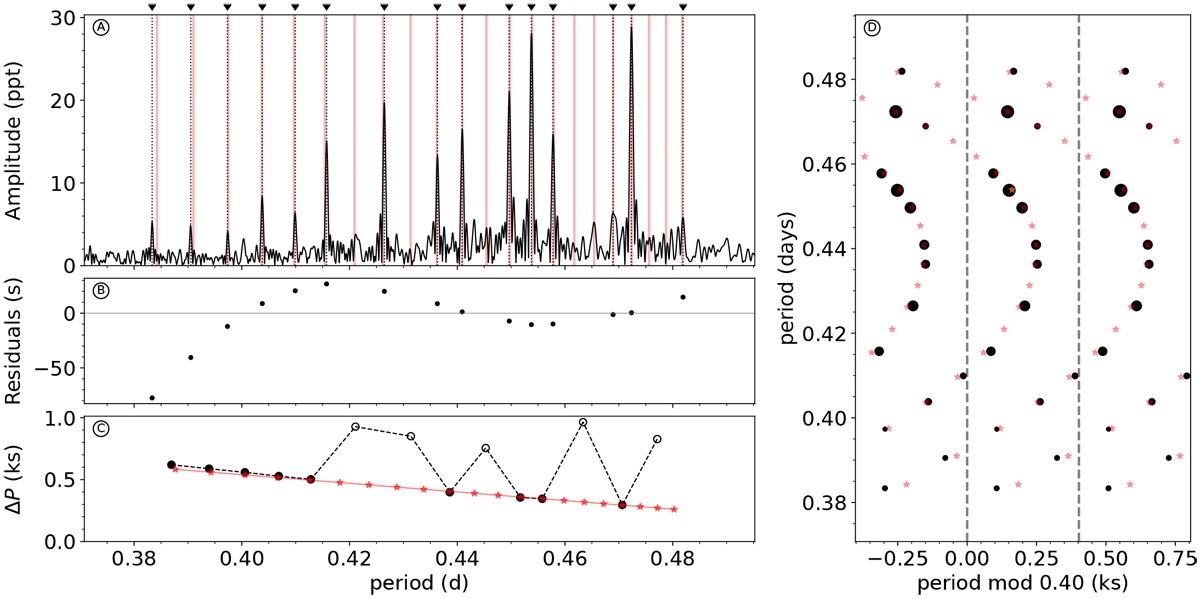
Best-fit period-spacing pattern for TIC 374944608. Plots generated with the interactive code FLOSSY. (A): Lomb–Scargle periodogram (solid black line), observed periods (vertical dotted black lines), best-fit linear template (vertical red lines). Observed periods used for the fit are indicated with black triangles at the top. (B): deviations from the linear pattern (i.e., difference between the periods indicated by the black triangles and the red vertical lines). (C): period spacing as a function of mode period. Both black and white circles are the observations. The red markers are the best-fit linear pattern with slope α. Note that the fit is performed on p, not on ΔP, and missing mode periods in the observations create artificially larger ΔP values (white circles). (D): échelle diagram. The black circles are the periods used for the fit. The size of the circles is proportional to the amplitude of the amplitudes in the periodogram. The red markers are the best-fit linear pattern. The supplementary material contains a version of this figure for every pattern in our catalog.
Current usage metrics show cumulative count of Article Views (full-text article views including HTML views, PDF and ePub downloads, according to the available data) and Abstracts Views on Vision4Press platform.
Data correspond to usage on the plateform after 2015. The current usage metrics is available 48-96 hours after online publication and is updated daily on week days.
Initial download of the metrics may take a while.