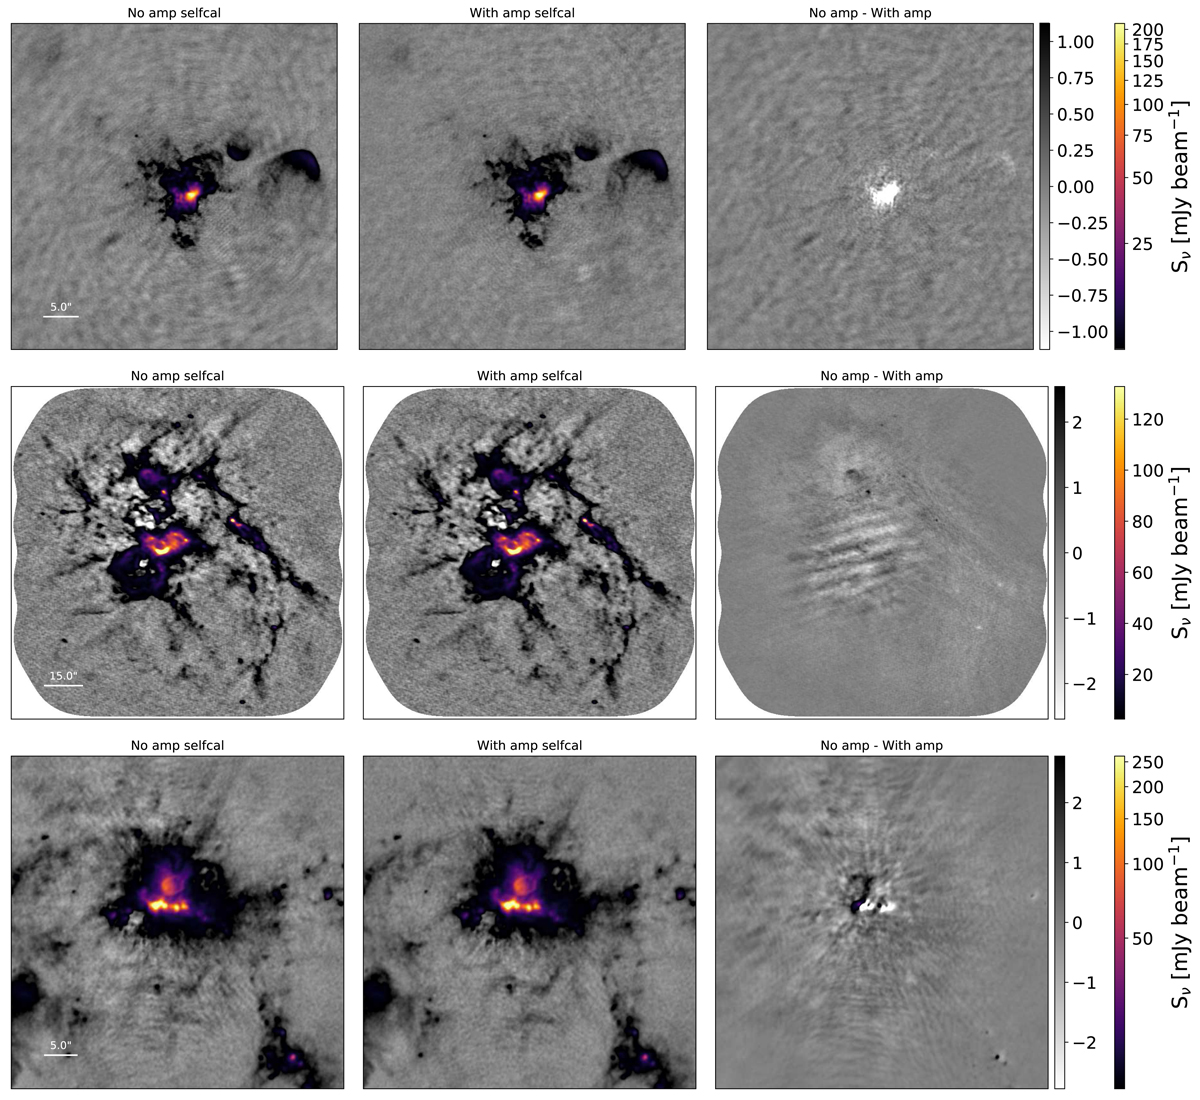
Fig. 8.
Download original image
Figures demonstrating the change before amplitude self-calibration (left) vs. after amplitude self-calibration (middle), with the difference of no-amplitude minus with-amplitude self calibration shown on the right to highlight the differences. These three images, G010.62 B3 (top), G012.80 B6 (center), and W51-IRS2 B6 (bottom) showed the greatest structural difference and greatest noise improvement with amplitude self-calibration included. While the noise decreased, and structure moved, the sum of the flux and the peak intensity changed by < 2% in each case. The images use the cleanest spectral selection.
Current usage metrics show cumulative count of Article Views (full-text article views including HTML views, PDF and ePub downloads, according to the available data) and Abstracts Views on Vision4Press platform.
Data correspond to usage on the plateform after 2015. The current usage metrics is available 48-96 hours after online publication and is updated daily on week days.
Initial download of the metrics may take a while.