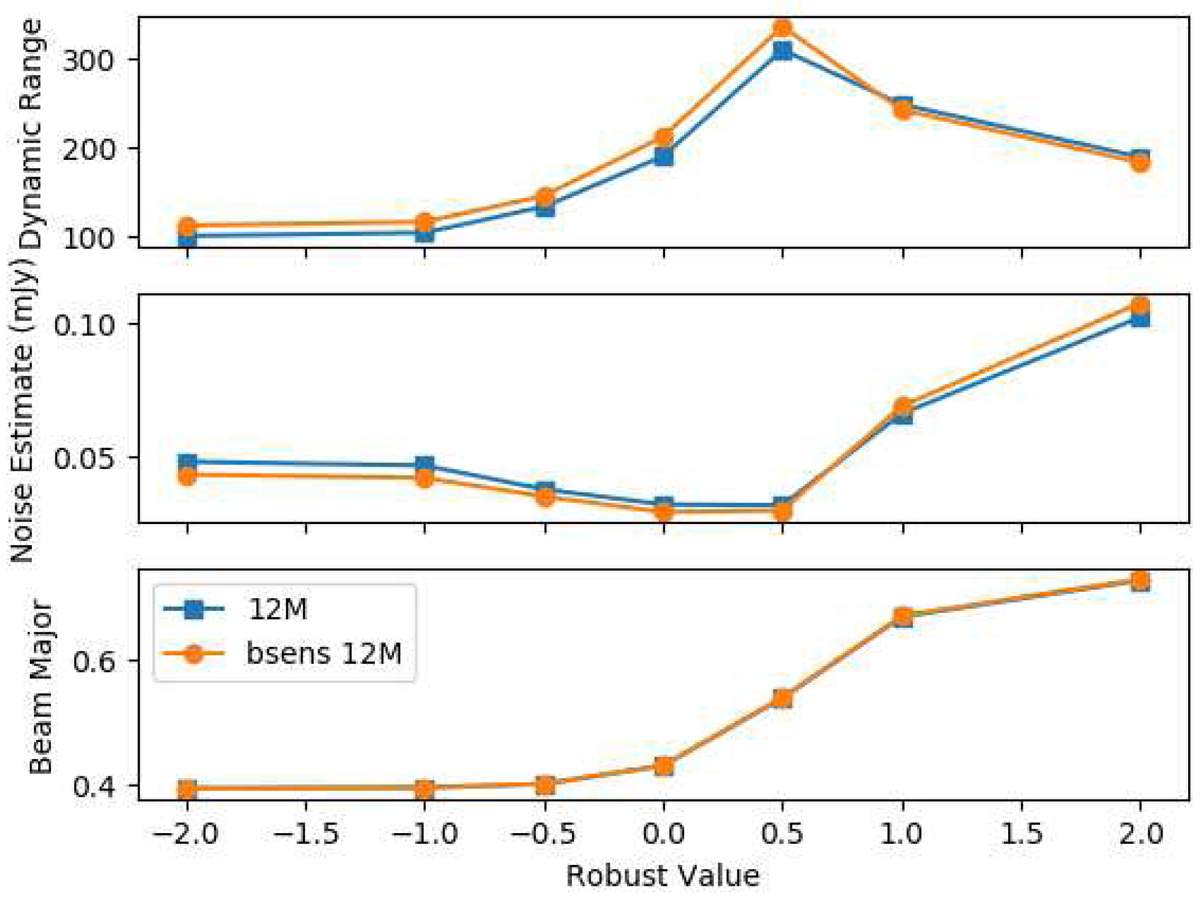
Fig. 7.
Download original image
Top: Estimated dynamic range (peak signal divided by noise estimate) as a function of Briggs robust parameter for the W43-MM3 B3 mosaic. Middle: Estimate of the noise as a function of Briggs robust parameter. Bottom: Beam major axis FWHM in arcseconds as a function of the Briggs robust parameter. In all three figures, the lines show the cleanest (blue squares) and “best sensitivity” (bsens; orange circles) data. The noise is estimated in a relatively signal-free region selected from the robust = 0 maps; the rise in noise to higher robust values is partly or entirely caused by added large-scale signal in these regions.
Current usage metrics show cumulative count of Article Views (full-text article views including HTML views, PDF and ePub downloads, according to the available data) and Abstracts Views on Vision4Press platform.
Data correspond to usage on the plateform after 2015. The current usage metrics is available 48-96 hours after online publication and is updated daily on week days.
Initial download of the metrics may take a while.