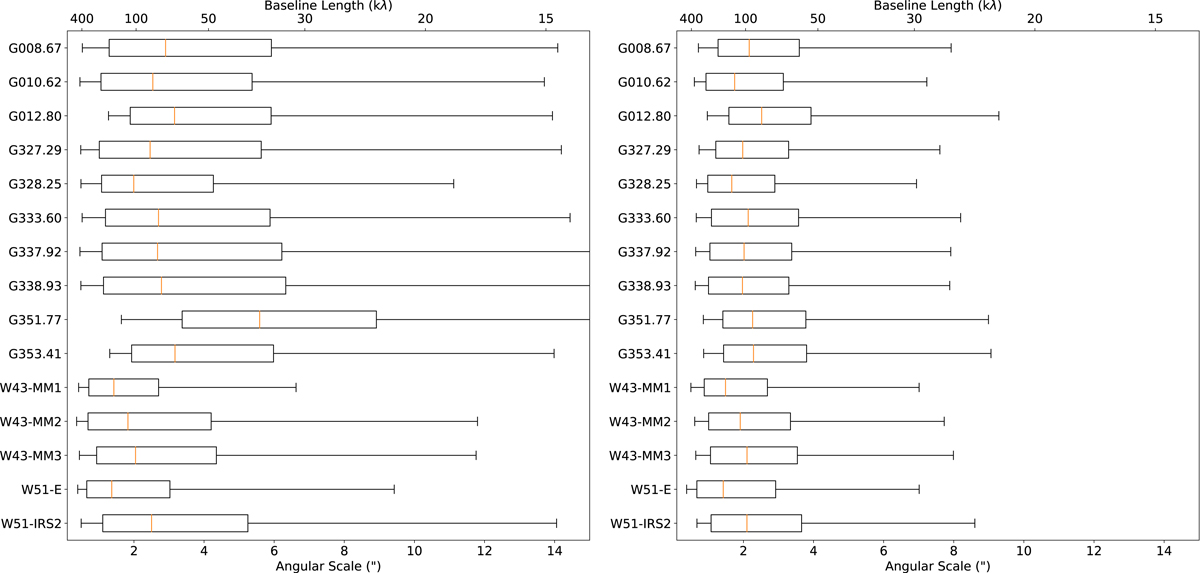
Fig. 5.
Download original image
Summary of observed, but un-weighted, uv spacing in all data sets. B3 is left, B6 is right. Each row shows a box plot in which the “whiskers” at either end show the 5th and 95th percentile, the box ends show the 25th and 75th percentile, and the orange line shows the median of baseline length or angular scale. More detailed histograms are given in Fig. 4, demonstrating that the weighted and unweighted baseline lengths are similar. A similar overview figure scaled to the distance of the individual sources is shown in Fig. 6.
Current usage metrics show cumulative count of Article Views (full-text article views including HTML views, PDF and ePub downloads, according to the available data) and Abstracts Views on Vision4Press platform.
Data correspond to usage on the plateform after 2015. The current usage metrics is available 48-96 hours after online publication and is updated daily on week days.
Initial download of the metrics may take a while.