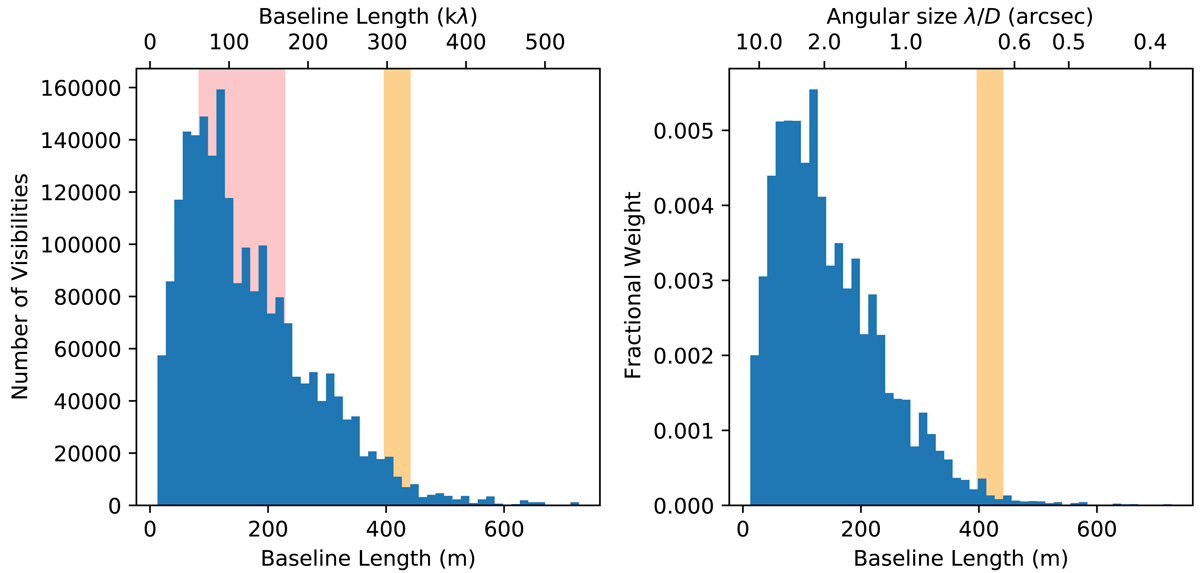
Fig. 4.
Download original image
Histograms of the uv sampling of the observations of G327.29 in Band 6. The left histogram shows the number of visibilities as a function of baseline length. In this panel, the top axis indicates the baseline length in units of kilolambda, that is, thousands of wavelengths. The red highlighted region shows the 25th–75th percentile of baseline lengths: half of the data are in this range, illustrating that scales ≲5″ are well-covered in this data set (the peak of the histogram is near ∼5″). The right histogram shows the fractional weight in the visibilities as a function of baseline length; the similarity of the left and right panels shows that the visibility weighting does not substantially deviate from uniformity. In this panel, the top axis indicates the corresponding angular size scale inferred from the equation θ = λ/B, where λ is the observed wavelength and B is the baseline length. Note that the weights are the per-visibility weights derived from the measurement calibration process; the final weights used for gridding are modified by the CLEAN algorithm gridding. In both panels, the orange highlighted region covers the range from the beam major to minor axis.
Current usage metrics show cumulative count of Article Views (full-text article views including HTML views, PDF and ePub downloads, according to the available data) and Abstracts Views on Vision4Press platform.
Data correspond to usage on the plateform after 2015. The current usage metrics is available 48-96 hours after online publication and is updated daily on week days.
Initial download of the metrics may take a while.