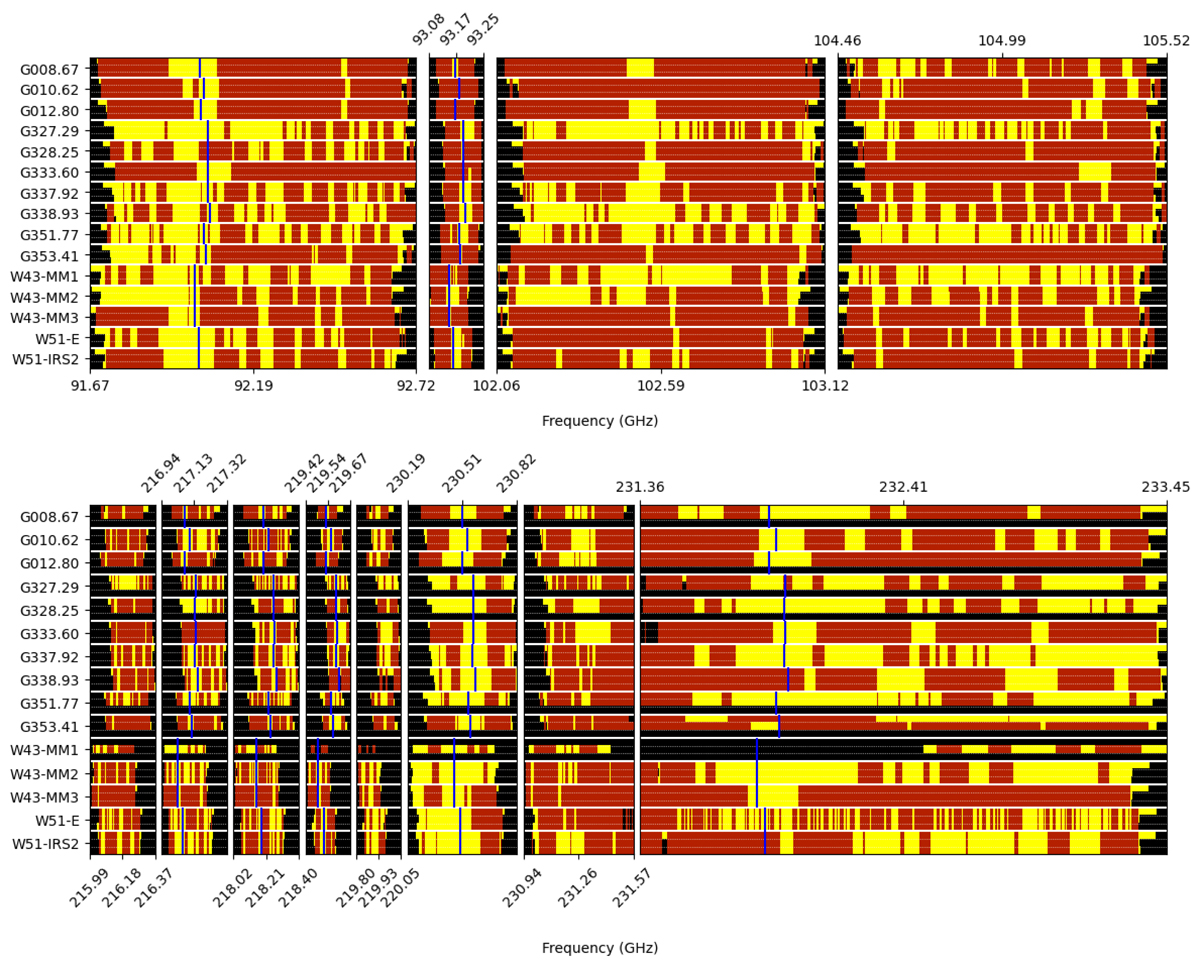
Fig. 3.
Download original image
Continuum selection figures for band 3 (top) and band 6 (bottom). For each field, there are up to three rows: the first is 7m, the second is the short-baseline configuration of the 12m array, and the third – when present – is the long-baseline configuration of the 12m array. Red shows data included in the continuum, yellow shows data excluded from the continuum, and black shows where no data were taken (for several fields, only one 12m configuration was used). The blue vertical lines show selected bright emission lines doppler shifted to the target velocity in these fields. Selected lines are N2H+ 1-0, SiO 5-4, H2CO 30, 3 − 20, 2, 12CO 2-1, H30α, H41α, and C18O 2-1. The X-axis shows frequency in the kinematic local standard of rest (LSRK) frame. W43-MM1 B6 was observed with a slightly different frequency setup; its spectral coverage continues beyond the right edge of the plot.
Current usage metrics show cumulative count of Article Views (full-text article views including HTML views, PDF and ePub downloads, according to the available data) and Abstracts Views on Vision4Press platform.
Data correspond to usage on the plateform after 2015. The current usage metrics is available 48-96 hours after online publication and is updated daily on week days.
Initial download of the metrics may take a while.