Fig. H.15.
Download original image
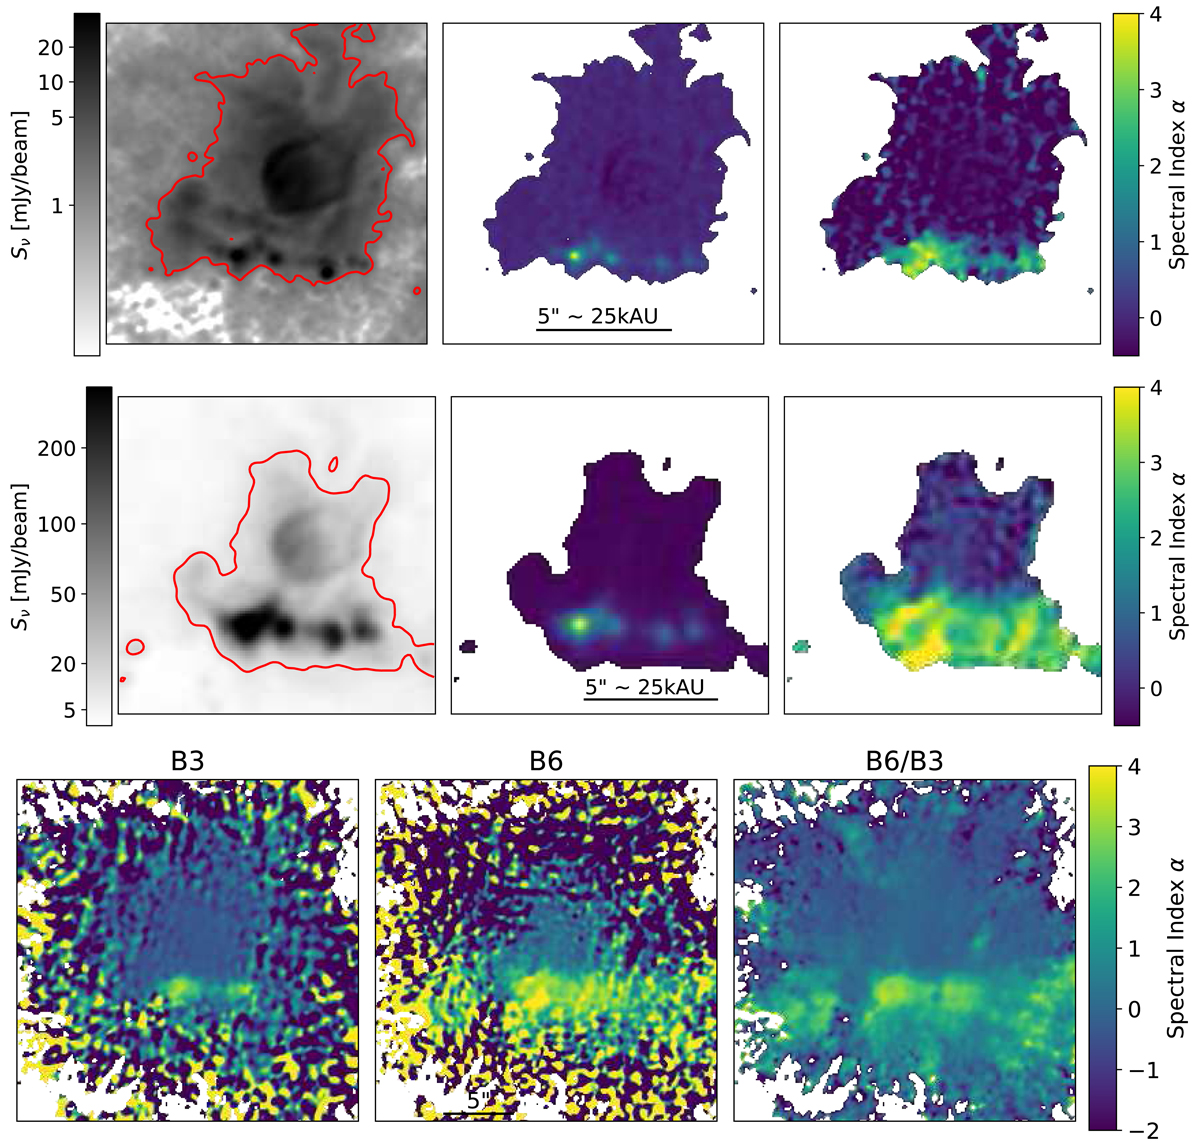
Spectral index images of W51-IRS2 in band 3 (top), band 6 (middle), and calculated from B3/B6 (bottom). As in Figures H.12 and H.13, for the top two rows, the left panel is the tt0 term, the middle panel is tt1, and the right panel is the derived spectral index α. The compact sources along the south end of the image are clearly dust-dominated, with α ∼ 3 − 4 in both bands. The brightest compact source, W51 north, is evidently optically thick at 1 mm but thin at 3 mm, with α1mm ≈ 2 and α3mm ≈ 4, as has been previously observed (Ginsburg et al. 2017; Goddi et al. 2020). See also Fig. 2m of Paper I; Motte et al. (2022).
Current usage metrics show cumulative count of Article Views (full-text article views including HTML views, PDF and ePub downloads, according to the available data) and Abstracts Views on Vision4Press platform.
Data correspond to usage on the plateform after 2015. The current usage metrics is available 48-96 hours after online publication and is updated daily on week days.
Initial download of the metrics may take a while.