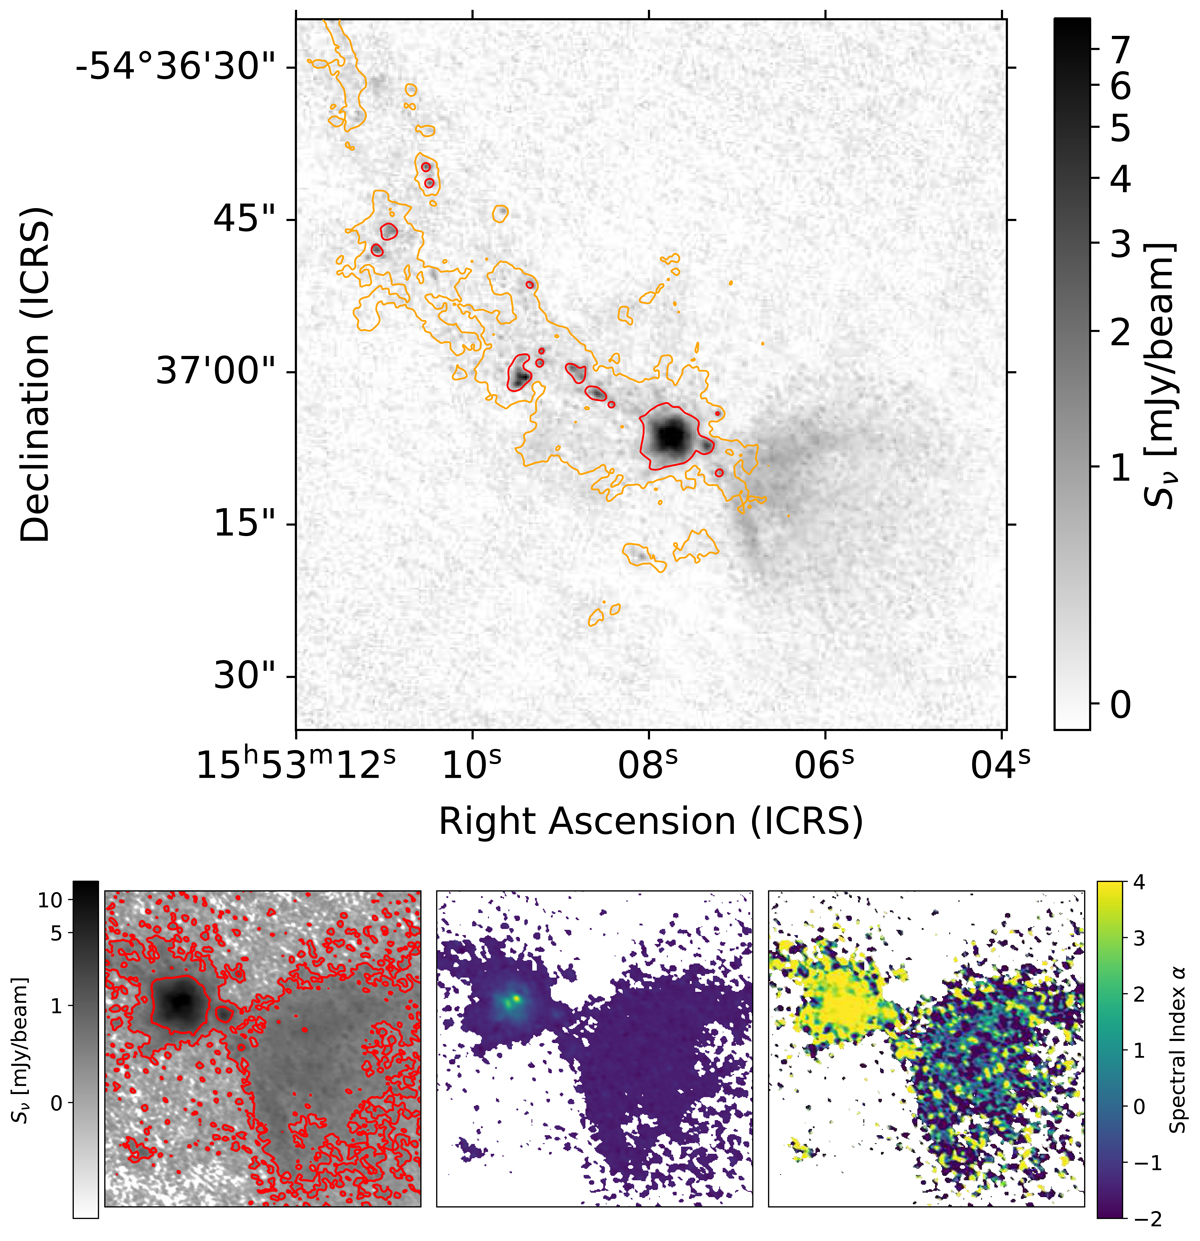
Fig. H.13.
Download original image
(top) The G327.29 B3 (cleanest) image is shown in greyscale with contours of the B6 data overlaid (orange: 3 mJy/beam, red: 20 mJy/beam). While the compact sources match well between the two bands, the HII region to the southwest appears only in B3. (lower panels) As in Figure H.12, these panels show Taylor terms 0 (left) and 1 (middle) and the spectral index α (right) of a cutout around the brightest core. The dust-dominated, compact source has a steep α ∼ 4, while the extended, free-free-dominated HII region has a flat index α ∼ 0. See also Fig. 2f of Paper I; Motte et al. (2022).
Current usage metrics show cumulative count of Article Views (full-text article views including HTML views, PDF and ePub downloads, according to the available data) and Abstracts Views on Vision4Press platform.
Data correspond to usage on the plateform after 2015. The current usage metrics is available 48-96 hours after online publication and is updated daily on week days.
Initial download of the metrics may take a while.