Fig. H.12.
Download original image
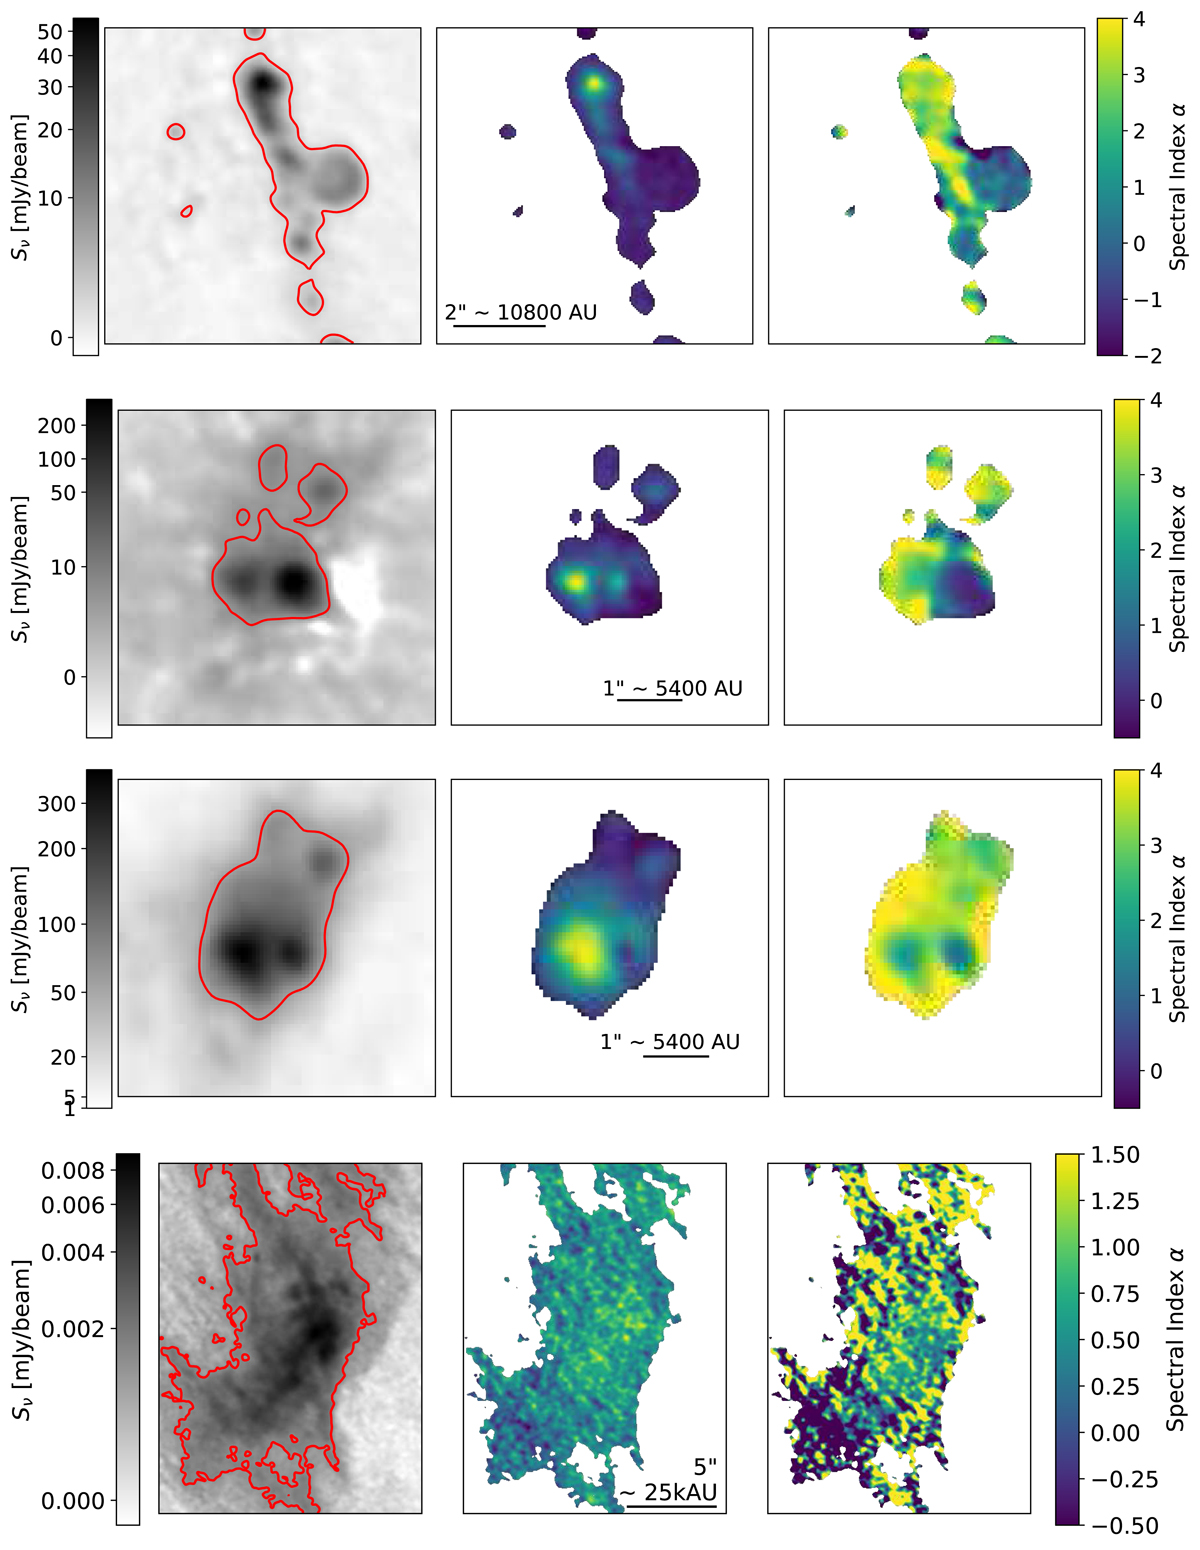
W51-E B3 Spectral Index maps distinguish HII regions from dust-dominated objects. In each panel, the left image shows the tt0 (Taylor term 0), which is our approximation of the continuum level and is used to create a mask. The middle panel shows the tt1 image. The rightmost panel shows ![]() , the spectral index, and we have truncated the display to a plausible physical range −2 < α < 4; values beyond this range most likely represent measurement errors. (top) W51 e1/e8. The circular object to the right is an ultracompact HII region. (top-middle) W51 e2 B3. This source splits into e2e, the dust-dominated (α ∼ 4) source to the left, and e2w, the hypercompact HII region with α ∼ 0 − 1. W51 e2w shows signs of a changing spectral index across the band, as it appears to be the source of the symmetric ringing errors that span the image. (bottom-middle) W51 e2 B6. The HII region e2w remains relatively flat, though somewhat more positively sloped than a pure free-free source; it contains at least some dust. W51 e2e has a slightly shallower slope than at B3, indicating that it is optically thick (α = 2). (bottom) W51 IRS1 / Main, the extended HII region that dominates the overall image. There is no clear detection in the tt1 term, suggesting α ∼ 0, which is expected for an optically thin HII region. See also Fig. 2k in Paper I; Motte et al. (2022).
, the spectral index, and we have truncated the display to a plausible physical range −2 < α < 4; values beyond this range most likely represent measurement errors. (top) W51 e1/e8. The circular object to the right is an ultracompact HII region. (top-middle) W51 e2 B3. This source splits into e2e, the dust-dominated (α ∼ 4) source to the left, and e2w, the hypercompact HII region with α ∼ 0 − 1. W51 e2w shows signs of a changing spectral index across the band, as it appears to be the source of the symmetric ringing errors that span the image. (bottom-middle) W51 e2 B6. The HII region e2w remains relatively flat, though somewhat more positively sloped than a pure free-free source; it contains at least some dust. W51 e2e has a slightly shallower slope than at B3, indicating that it is optically thick (α = 2). (bottom) W51 IRS1 / Main, the extended HII region that dominates the overall image. There is no clear detection in the tt1 term, suggesting α ∼ 0, which is expected for an optically thin HII region. See also Fig. 2k in Paper I; Motte et al. (2022).
Current usage metrics show cumulative count of Article Views (full-text article views including HTML views, PDF and ePub downloads, according to the available data) and Abstracts Views on Vision4Press platform.
Data correspond to usage on the plateform after 2015. The current usage metrics is available 48-96 hours after online publication and is updated daily on week days.
Initial download of the metrics may take a while.