Fig. H.11.
Download original image
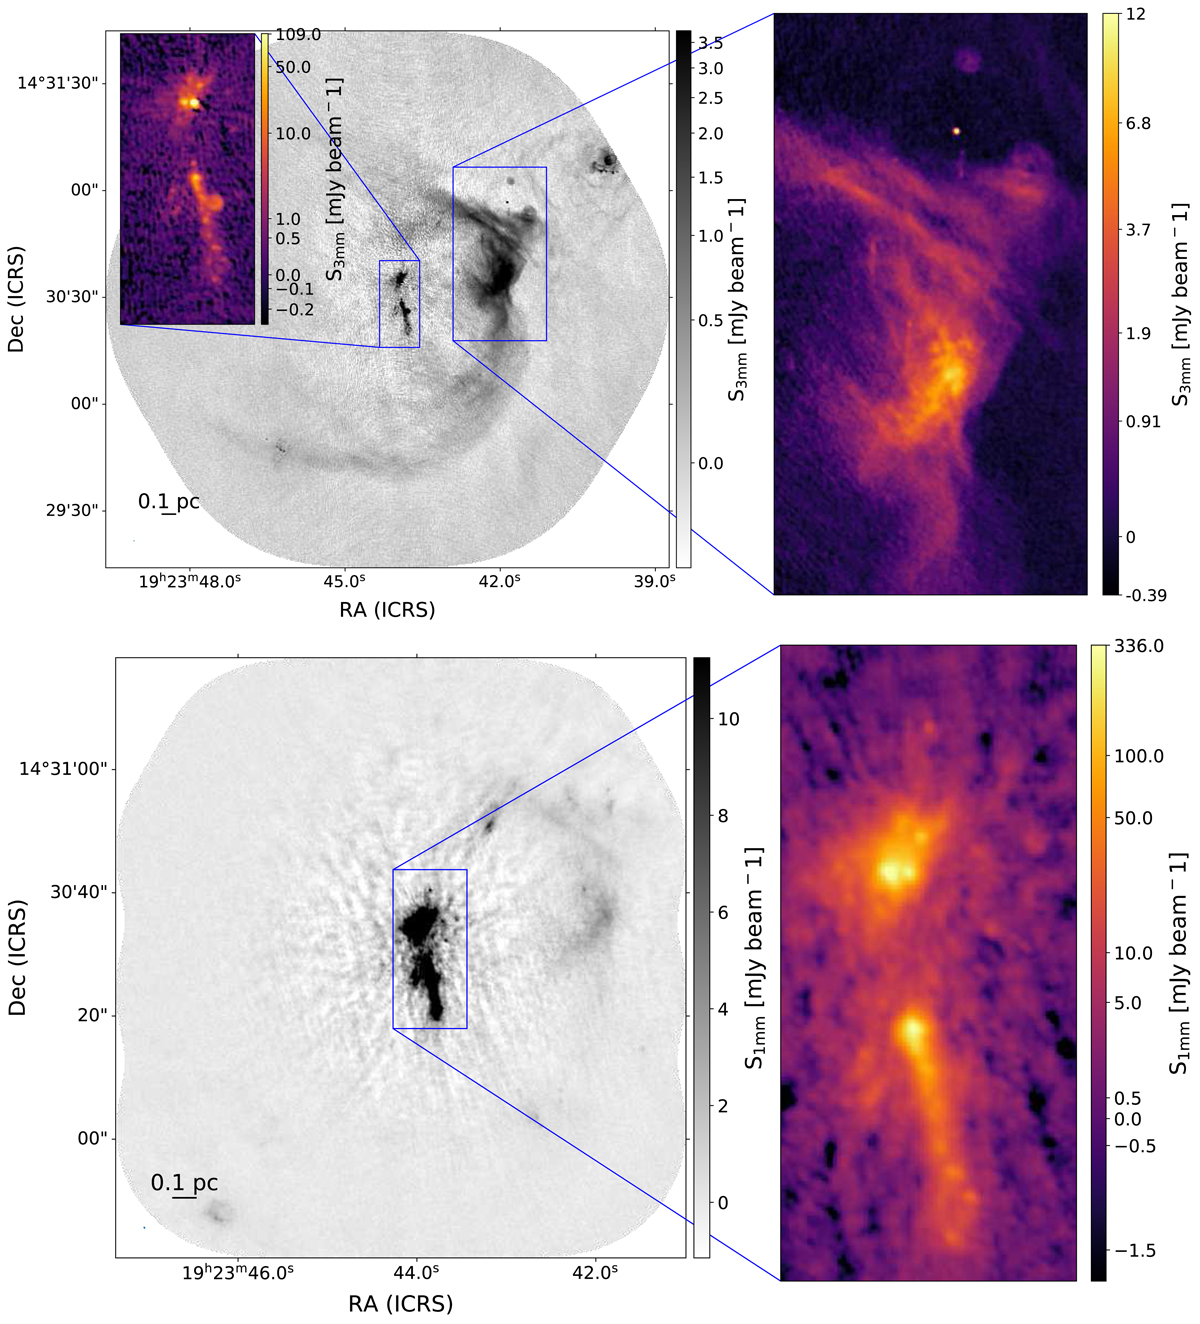
Inset zoom figures of the B3 (top) and B6 (bottom) images of W51-E. The insets highlight the regions shown in detail in Figure H.12. The central region, containing W51 e1 through e10, is shown in both insets. W51 e1/e8 is the southern part of this region, shown in Fig. H.12a. W51 e2 is the northern part of this region, shown in Fig. H.12b and c. The diffuse HII region W51 Main shown as a zoom panel to the right of the top figure showing the B3 image; its spectral index map is shown in Fig. H.12d.
Current usage metrics show cumulative count of Article Views (full-text article views including HTML views, PDF and ePub downloads, according to the available data) and Abstracts Views on Vision4Press platform.
Data correspond to usage on the plateform after 2015. The current usage metrics is available 48-96 hours after online publication and is updated daily on week days.
Initial download of the metrics may take a while.