Fig. H.10.
Download original image
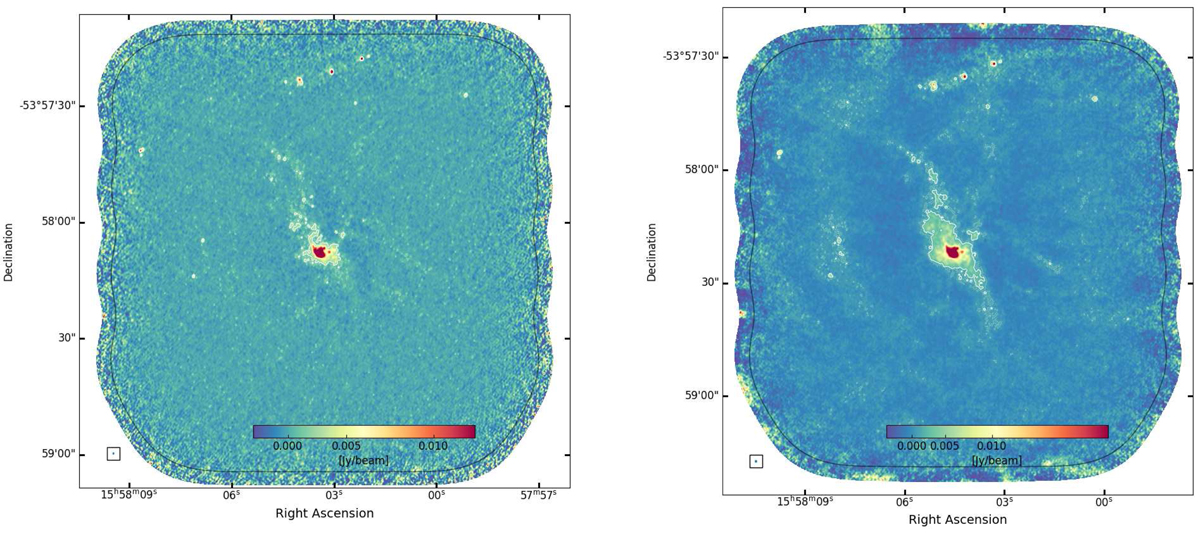
Left: ALMA 12m only continuum mosaic of the G328.25 clump in Band 3. White contours show 3 and 5 times the rms noise measured in an emission free region prior to the primary beam correction. Black contours show where the primary beam sensitivity drops to 20%. The synthesized beam is shown in the lower left corner, and the color bar is displayed in the bottom of the image. Right: ALMA 7m and 12m array combined continuum image in B3. Contours are the same as on the left panel, where the corresponding noise is measured on the combined map. The synthesized beam is shown in the lower left corner, and the color bar is displayed in the bottom of the image.
Current usage metrics show cumulative count of Article Views (full-text article views including HTML views, PDF and ePub downloads, according to the available data) and Abstracts Views on Vision4Press platform.
Data correspond to usage on the plateform after 2015. The current usage metrics is available 48-96 hours after online publication and is updated daily on week days.
Initial download of the metrics may take a while.