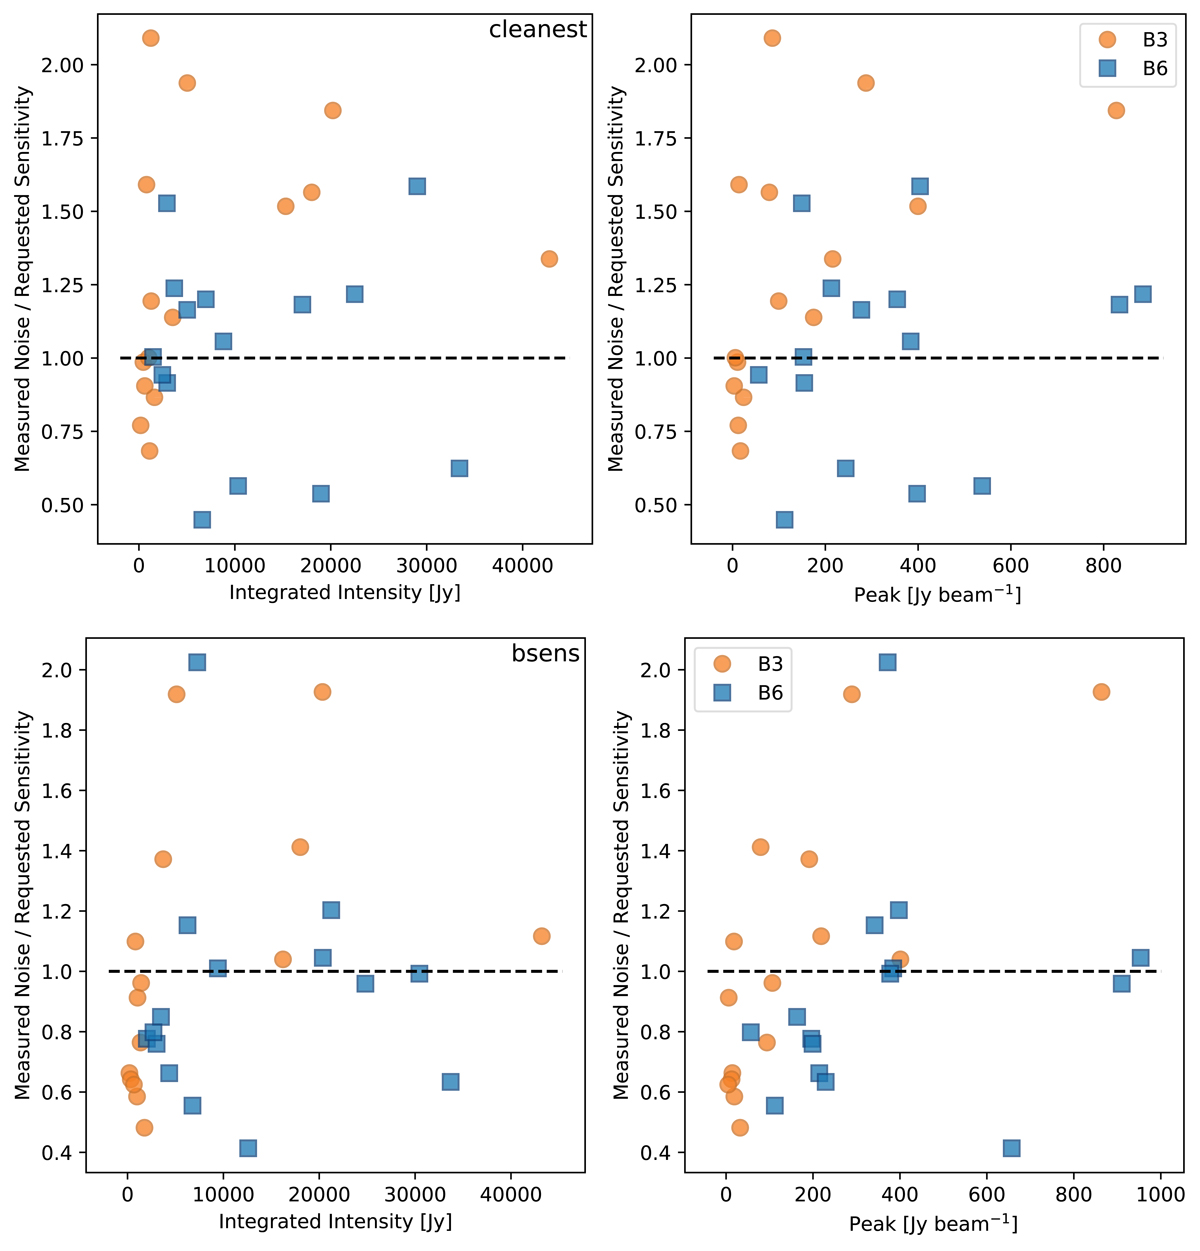
Fig. H.6.
Download original image
Excess noise in the images compared to the thermal noise level that was requested in the proposal. The top panels show cleanest continuum data, the bottom show bsens. The Y-axis shows the measured noise level in an image with the requested beam (i.e., σMAD(Ωsyn/Ωreq)1/2; see §3.3.3) divided by the requested noise level; higher values indicate higher measured noise. The horizontal dashed line indicates where the measured noise exactly matches the requested noise. The X-axis gives the total flux in the image (left panels) and peak intensity (right panels). We compare the noise to the total and peak flux to search for correlations that may explain the excess noise as deriving from some form of dynamic range limit, but we do not observe any clear correlation. The excess noise is caused by calibration errors, unresolved structure, and other possibilities discussed in Section 3.3.3
Current usage metrics show cumulative count of Article Views (full-text article views including HTML views, PDF and ePub downloads, according to the available data) and Abstracts Views on Vision4Press platform.
Data correspond to usage on the plateform after 2015. The current usage metrics is available 48-96 hours after online publication and is updated daily on week days.
Initial download of the metrics may take a while.