Fig. 11.
Download original image
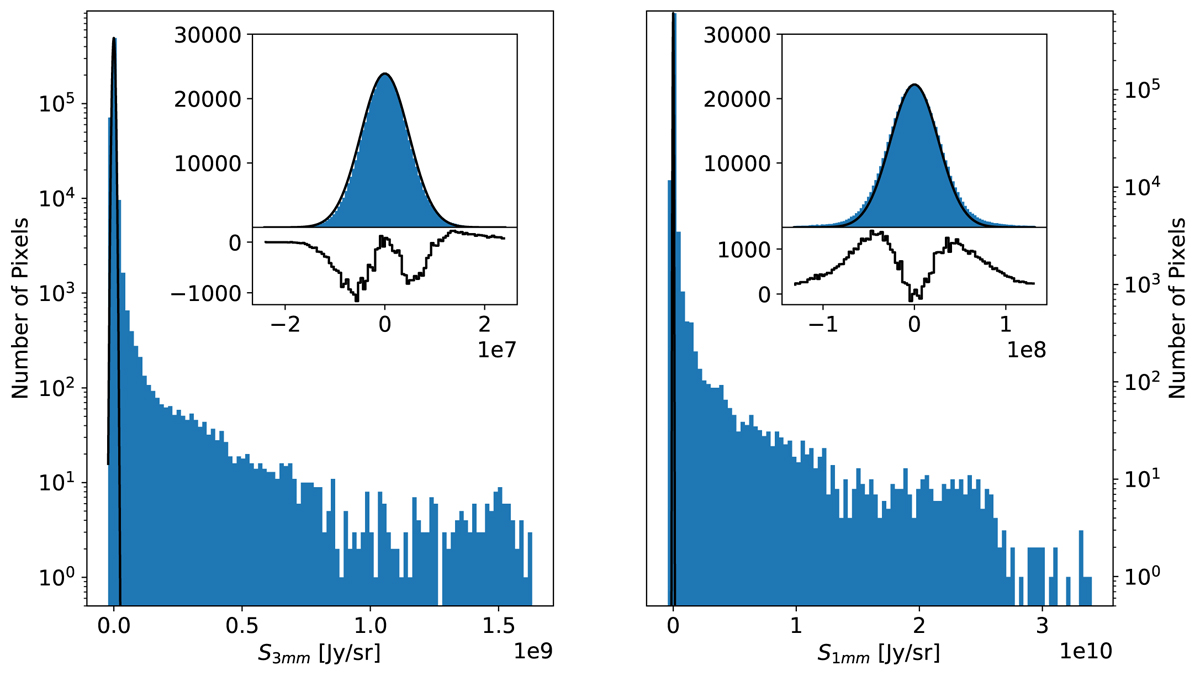
Histograms of the G351.77 cleanest self-calibrated continuum data, which illustrate the noise distribution. The left panel shows B3, the right B6. The inset shows a linearly-scaled zoom-in to the ±5σ region centered around zero, with the residual of the histogram minus the noise model shown below. The noise model is a Gaussian with width calculated from the median absolute deviation estimated from a signal-free area of the field as described in Sect. 3.3.1.
Current usage metrics show cumulative count of Article Views (full-text article views including HTML views, PDF and ePub downloads, according to the available data) and Abstracts Views on Vision4Press platform.
Data correspond to usage on the plateform after 2015. The current usage metrics is available 48-96 hours after online publication and is updated daily on week days.
Initial download of the metrics may take a while.