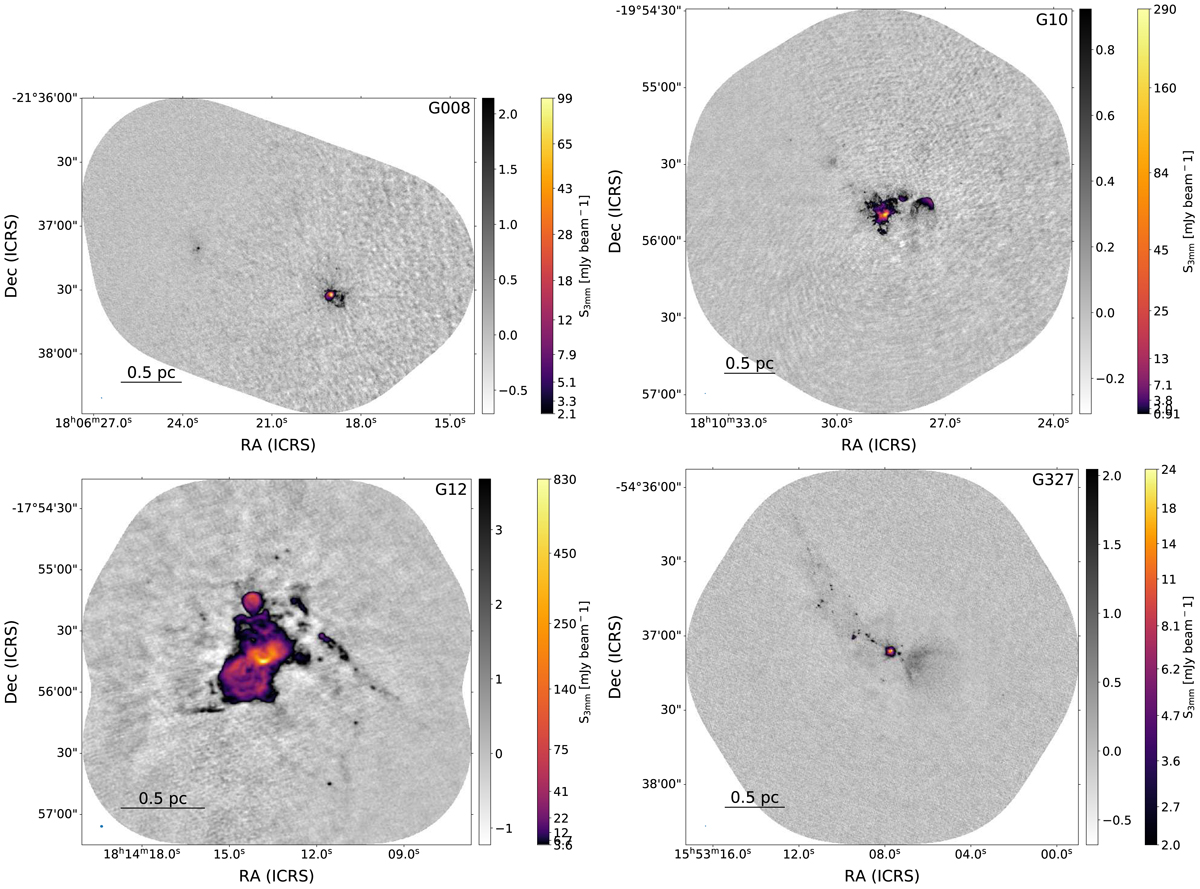
Fig. 1.
Download original image
Overview plot showing B3 continuum emission maps. The plots are shown with two colorbars, the first (grayscale) showing −5 to +15 times the noise on a linear scale, then a second (matplotlib’s inferno colorscheme) showing the range +15 times the noise to the peak intensity of the image in an arcsinh stretch. The field names are labeled in the top-right corner. A scalebar in the bottom-left shows the size of 0.5 pc at the target’s distance. The synthesized beam is shown as a blue ellipse in the bottom-left corner; it may be too small to print properly. Only the first four fields in B3 are shown here. The remaining figures are shown in Appendix H.
Current usage metrics show cumulative count of Article Views (full-text article views including HTML views, PDF and ePub downloads, according to the available data) and Abstracts Views on Vision4Press platform.
Data correspond to usage on the plateform after 2015. The current usage metrics is available 48-96 hours after online publication and is updated daily on week days.
Initial download of the metrics may take a while.