Fig. 8
Download original image
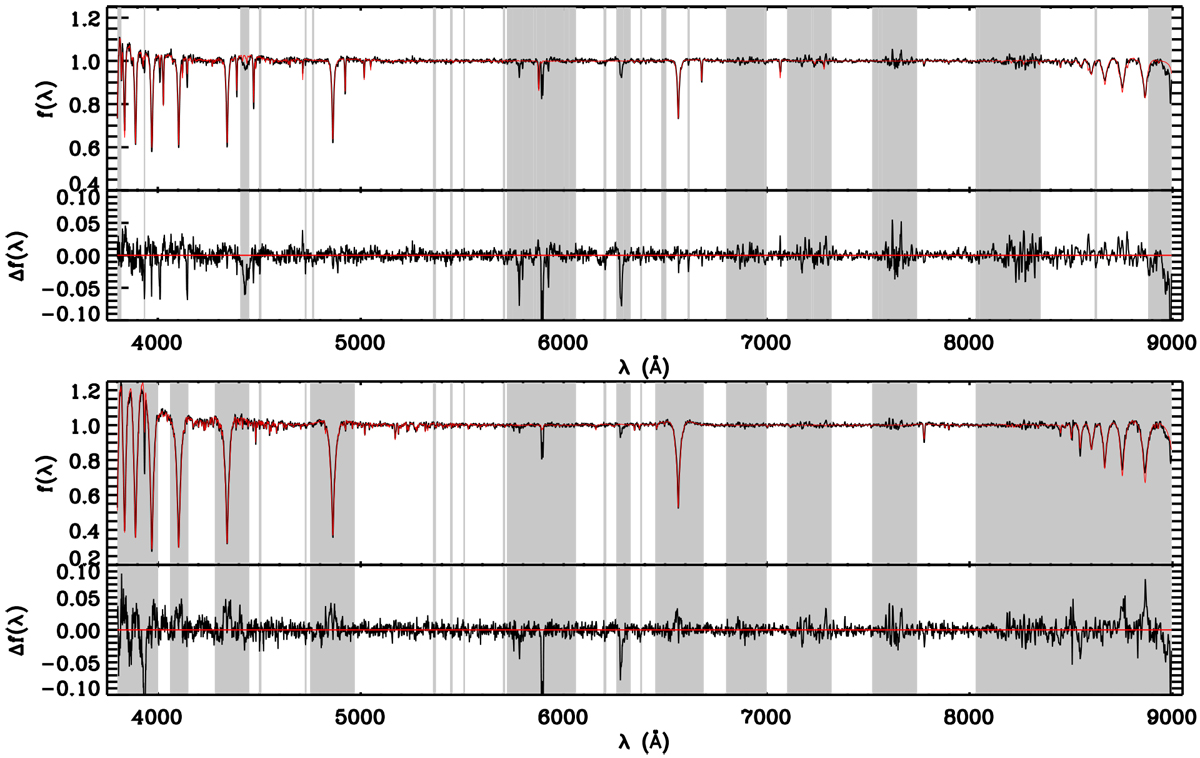
Example of the HotPayne fit for a B-type star (top) and an early A-type star (bottom). The LAMOST spectra are shown in black, and the best-fit HotPayne models are shown in red. The masked telluric bands, the DIB, the interstellar absorption of Na and Ca, and the dichroic region are marked by shaded regions. For the case of early A-type stars, the wavelength windows of hydrogen lines (Balmer and Paschen series) are also masked (see text).
Current usage metrics show cumulative count of Article Views (full-text article views including HTML views, PDF and ePub downloads, according to the available data) and Abstracts Views on Vision4Press platform.
Data correspond to usage on the plateform after 2015. The current usage metrics is available 48-96 hours after online publication and is updated daily on week days.
Initial download of the metrics may take a while.