Fig. 6
Download original image
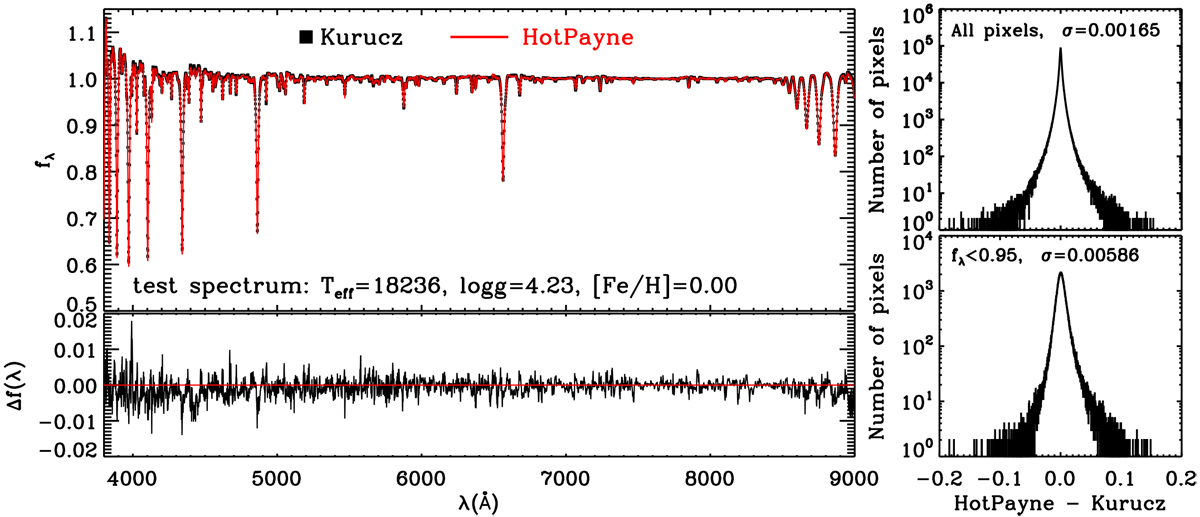
Precision of the spectrum prediction by HOTPAYNE, which entails a neural-net-enabled interpolation among Kurucz model spectra. The left panels show the comparison between the Kurucz spectrum and its prediction by HOTPAYNE for a test star with Teff = 18 236 K, log g = 4.23, and [Fe/H] = 0.0. Top-right panel: distribution of flux residuals for all of our 1012 test spectra, each with 3801 pixels in the wavelength range of λλ3750–9000 Å. A Gaussian fit to the distribution yields a standard deviation of 0.165%. Bottom-right panel: analogous to the top-right panel, but only for pixels whose normalized spectral fluxes are smaller than 0.95, i.e., for strong absorption lines, mostly the cores of H and He lines. The standard deviation from a Gaussian fit is 0.586% for the strong absorption features.
Current usage metrics show cumulative count of Article Views (full-text article views including HTML views, PDF and ePub downloads, according to the available data) and Abstracts Views on Vision4Press platform.
Data correspond to usage on the plateform after 2015. The current usage metrics is available 48-96 hours after online publication and is updated daily on week days.
Initial download of the metrics may take a while.