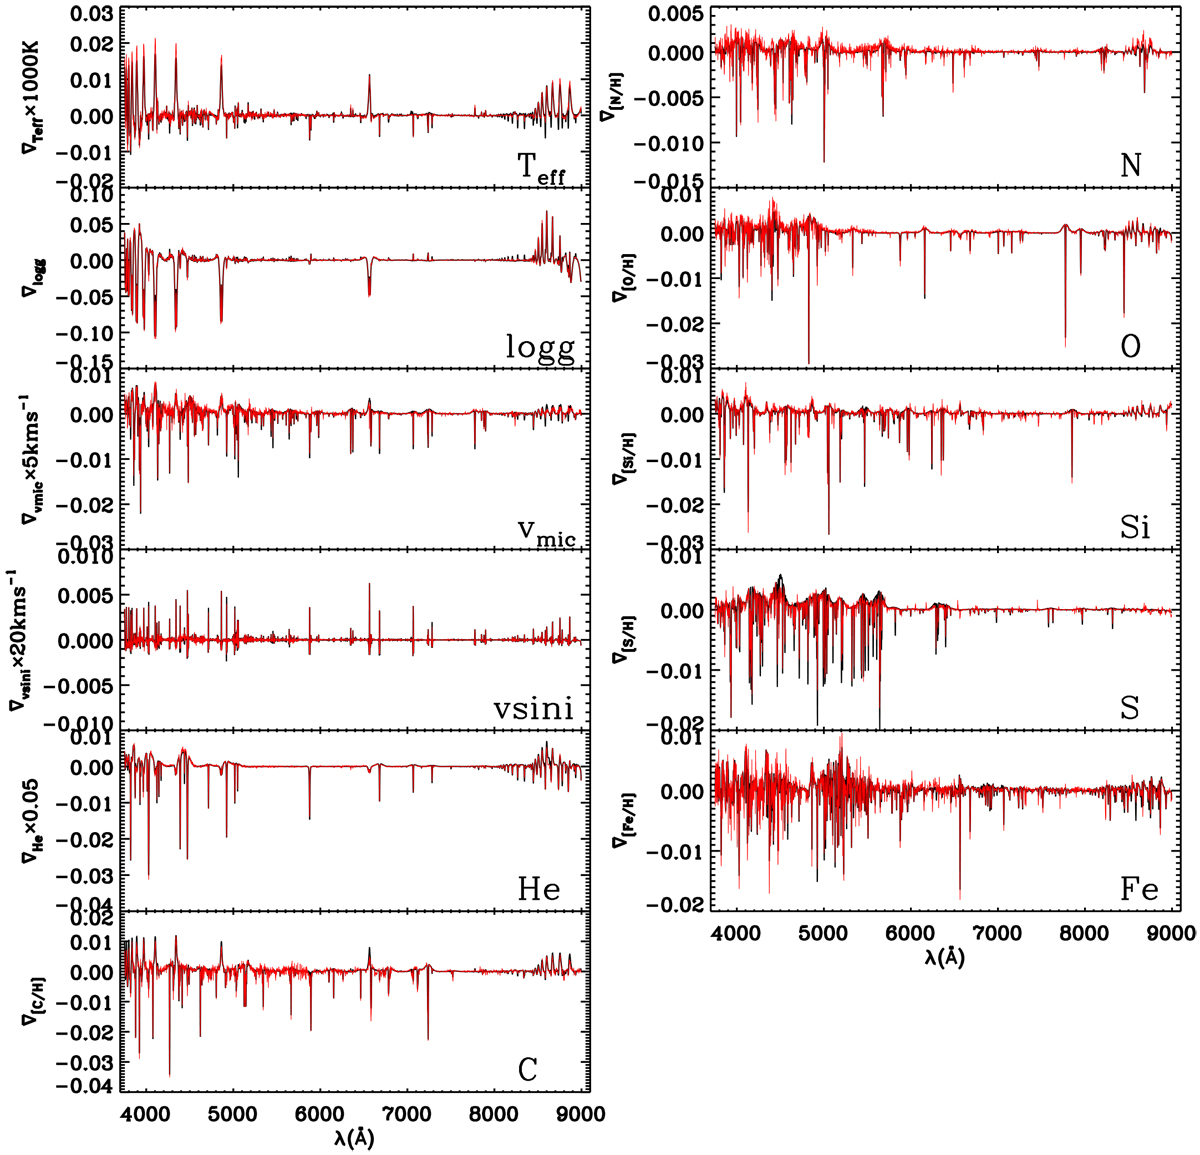
Fig. 3
Download original image
Information content of low-resolution spectra for a B star. Each panel shows the gradient spectrum ∇l : = ∂fλ/∂l with respect to different labels, l, derived from finite differencing of Kurucz model spectra (black) at Teff = 18 000 K, log g = 4.0, [Fe/H] = 0, and vsin i = 100 km s−1. The gradient spectra generated from HOTPAYNE are overplotted in red, illustrating the robustness of HOTPAYNE: the good agreement to the Kurucz model suggests that HOTPAYNE determines the labels from the relevant features instead of harnessing the astrophysical correlations. For Teff, vmic, vsin i, and NHe/Ntot, the gradient spectra are multiplied by 1000 K in Teff, 5 km s−1 in vmic, 20 km s−1 in vsin i, and 0.05 in NHe/Ntot for better visibility. This figure shows that the diagnostic signatures of label changes are widely distributed across the optical spectral range. Nonetheless, most spectral features are subtle due to LAMOST’s spectral resolution and the high effective temperature of the star: most abundance signatures are at the 1% level, even for abundance changes of 1 dex. Useful information about hot stars can only be extracted from a global fit to the spectrum and a careful spectral modeling.
Current usage metrics show cumulative count of Article Views (full-text article views including HTML views, PDF and ePub downloads, according to the available data) and Abstracts Views on Vision4Press platform.
Data correspond to usage on the plateform after 2015. The current usage metrics is available 48-96 hours after online publication and is updated daily on week days.
Initial download of the metrics may take a while.