Fig. 18
Download original image
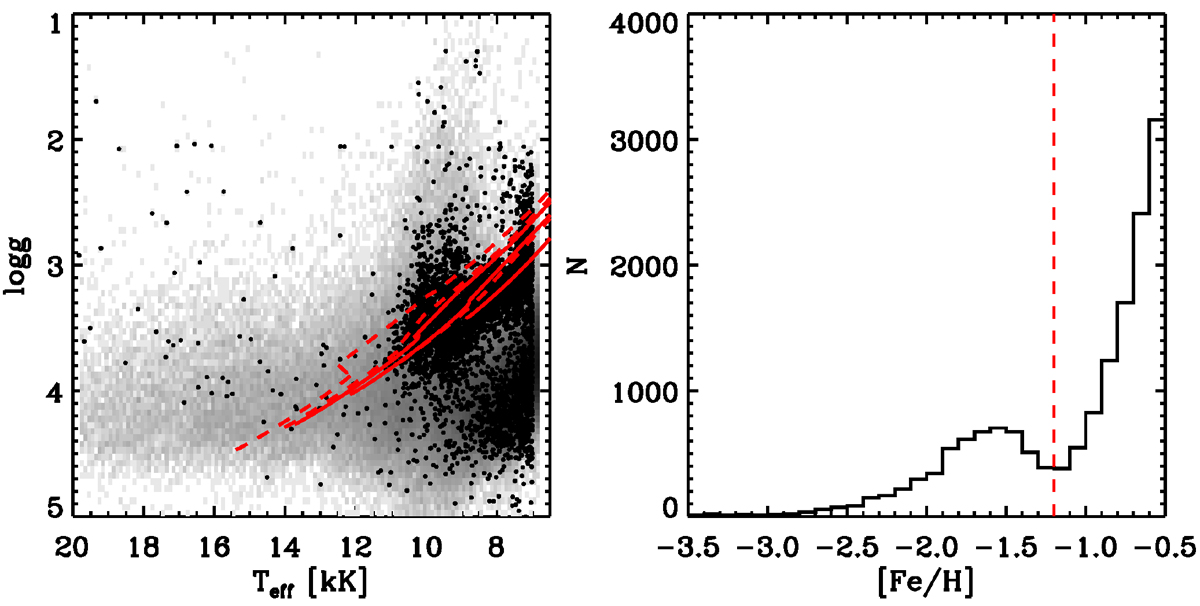
Illustration of halo BHB stars revealed in the Teff–log g diagram. Left: Background in gray scale showing the stellar density (in logarithmic scale) of our sample stars with S/N > 50. The black dots represent the stars with |b| > 15° and [Fe/H] < –1.2 dex. There are two sequences separated in log g: the upper sequence with lower log g values is composed of halo BHB stars, and the lower sequence with larger log g values is presumed to comprise blue straggler stars. The solid lines in red are MIST evolutionary tracks of He-burning stars with [Fe/H] = –1.5, V/Vc = 0.4, and masses of 0.65, 0.60, and 0.58 M⊙, respectively, from upper to lower. The dashed lines in red show similar tracks but for [Fe/H] = –2.0. Right: [Fe/H] distribution of our sample stars with S/N > 50 and |b| > 15°. Only the metal-poor side of [Fe/H] < –0.5 dex is shown. The vertical dashed line indicates a constant [Fe/H] of –1.2 dex, the sample below which mostly comprises the metal-poor halo BHB stars.
Current usage metrics show cumulative count of Article Views (full-text article views including HTML views, PDF and ePub downloads, according to the available data) and Abstracts Views on Vision4Press platform.
Data correspond to usage on the plateform after 2015. The current usage metrics is available 48-96 hours after online publication and is updated daily on week days.
Initial download of the metrics may take a while.