Fig. 16
Download original image
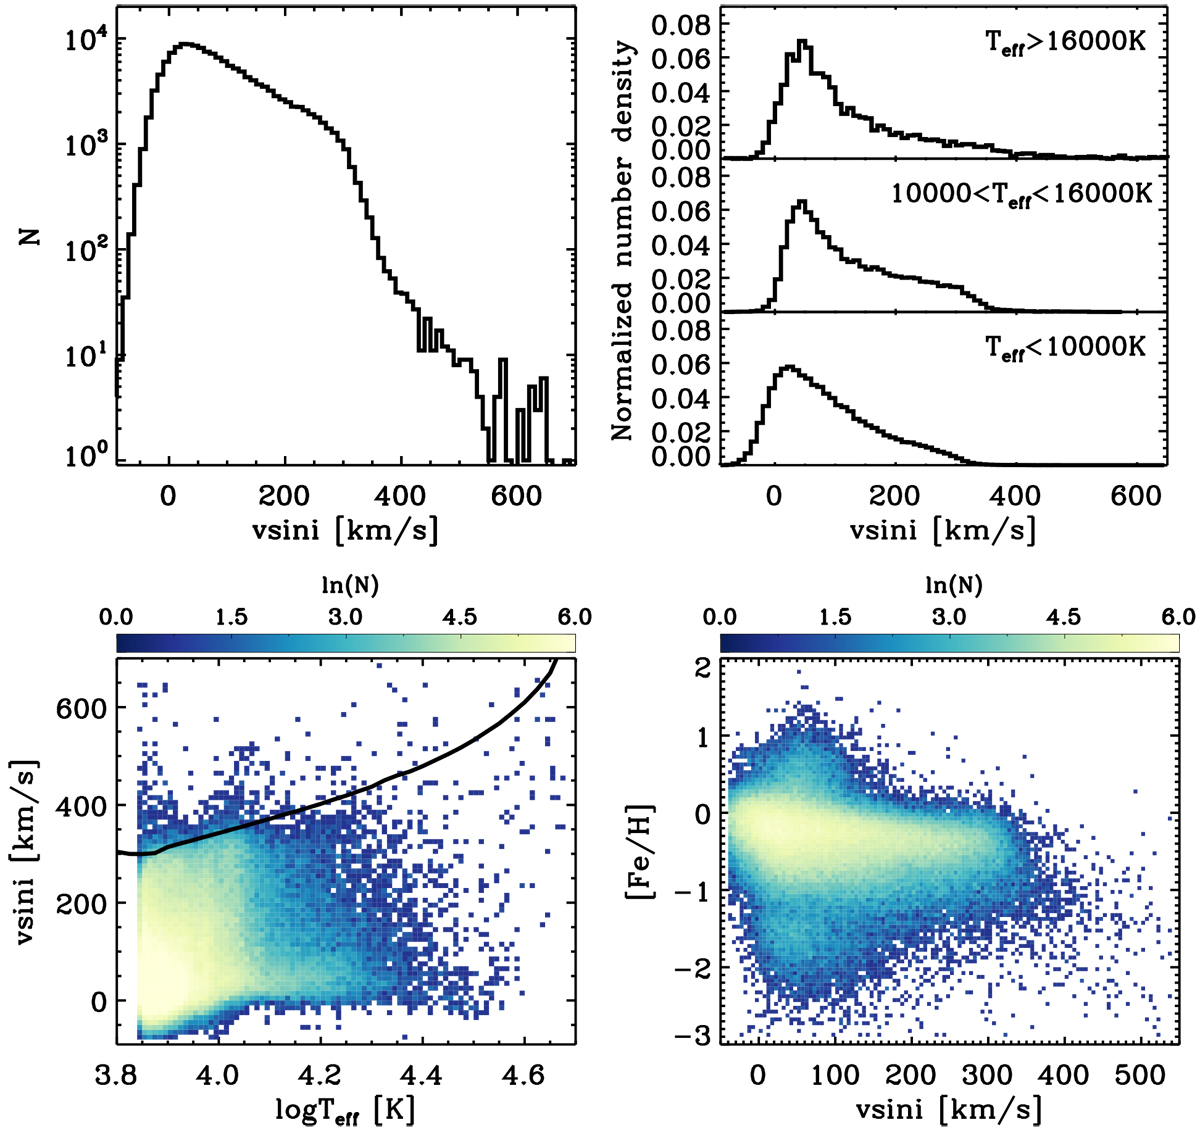
Distribution of vsin i. Top left: histogram of vsin i for the overall sample in this work. Only results from stars with S /N > 50 and log g < 5 are shown. Top right: histogram of vsin i for stars in different Teff ranges, as marked in the figure. Bottom left: stellar number density distribution in the Teff-vsin i plane. The solid line delineates the critical rotation velocity, Vc, as a function of Teff, derived based on the ZAMS MIST isochrones (Choi et al. 2016). Bottom right: stellar number density distribution in the [Fe/H]–vsin i plane. Since we do not impose a prior limit on vsin i, our fit allows for negative vsin i values. A negative vsin i simply means that the star has a small rotation velocity, and the distribution at the negative tail serves as a proxy for the measurement uncertainties.
Current usage metrics show cumulative count of Article Views (full-text article views including HTML views, PDF and ePub downloads, according to the available data) and Abstracts Views on Vision4Press platform.
Data correspond to usage on the plateform after 2015. The current usage metrics is available 48-96 hours after online publication and is updated daily on week days.
Initial download of the metrics may take a while.