Fig. 15
Download original image
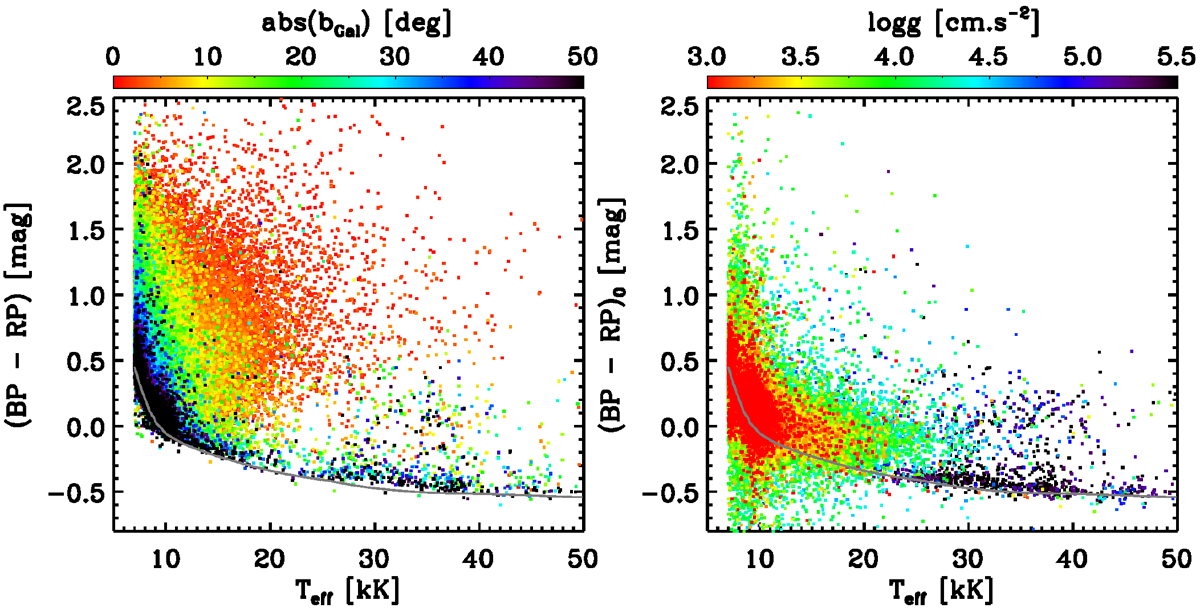
Observed and de-reddened (BP–RP) color as a function of effective temperature. Only stars with spectral S/N > 30 are shown. The left panel shows the observed (BP–RP) color vs. Teff, with the stars color-coded by Galactic latitude as a rough proxy for the expected dust reddening. The gray line delineates the MIST isochrones’ prediction for (BP–RP) color as a function of Teff for ZAMS stars with initial [Fe/H] = 0. This panel illustrates that our sample stars in low Galactic latitudes suffer from a large reddening effect, leading to much redder colors than stars at high Galactic latitudes. The right panel shows (BP–RP)0, the de-reddened color, based on the 3D reddening map of Green et al. (2019), with the stars sorted and color-coded by log g. The panel illustrates that such de-reddened colors qualitatively agree with the isochrones, but the significant spread in color at any given temperature implies that the photometric colors alone would be too imprecise to estimate Teff robustly for stars above 10 000 K. The very hot stars with little reddening and very high log g are presumably near subdwarf B stars of modest luminosity (see Fig. 14).
Current usage metrics show cumulative count of Article Views (full-text article views including HTML views, PDF and ePub downloads, according to the available data) and Abstracts Views on Vision4Press platform.
Data correspond to usage on the plateform after 2015. The current usage metrics is available 48-96 hours after online publication and is updated daily on week days.
Initial download of the metrics may take a while.