Fig. 14
Download original image
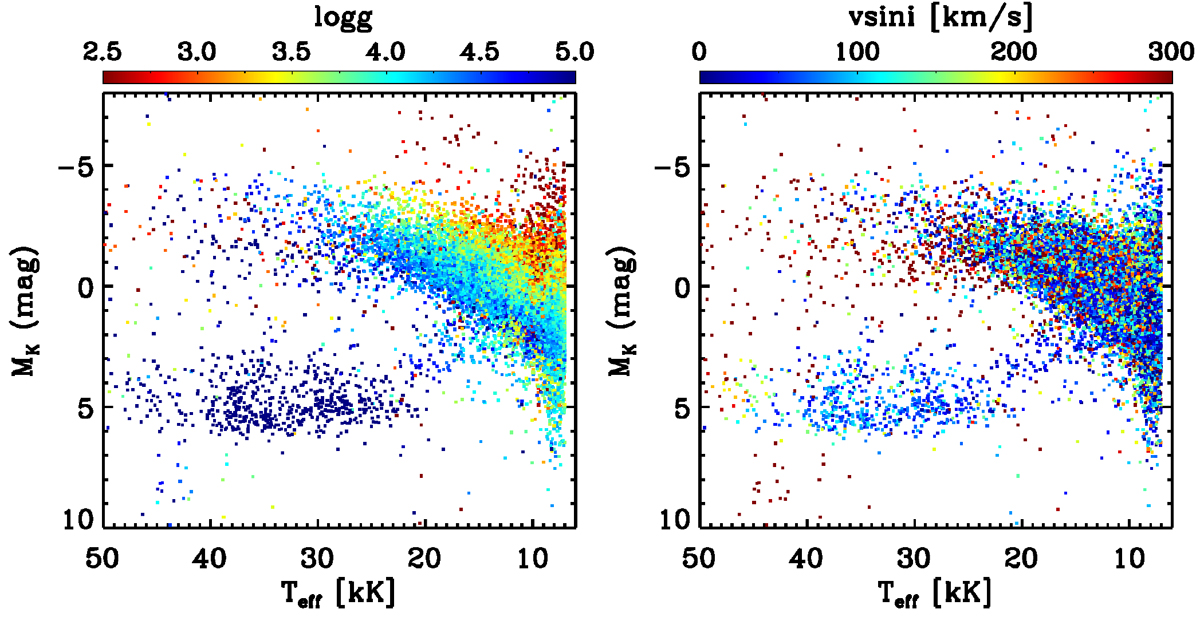
Stellar distribution in the Teff–MKs diagram color-coded by log g (left) and vsin i (right). Only 194724 stars with good spectral S/N (S/N > 30) and good parallax (ω/σω > 5) are shown. The expected correlation between log g with MKs at a given Teff demonstrates the robustness of the spectroscopic log g estimates. The stars with Teff ≳ 20 000 K and MKs ~ 5 mag are hot subdwarfs. In the left panel, a maximal log g value of 5 is displayed in the color bar, and all stars with log g > 5 are shown with the same color as log g = 5 (dark blue).
Current usage metrics show cumulative count of Article Views (full-text article views including HTML views, PDF and ePub downloads, according to the available data) and Abstracts Views on Vision4Press platform.
Data correspond to usage on the plateform after 2015. The current usage metrics is available 48-96 hours after online publication and is updated daily on week days.
Initial download of the metrics may take a while.