Fig. 13
Download original image
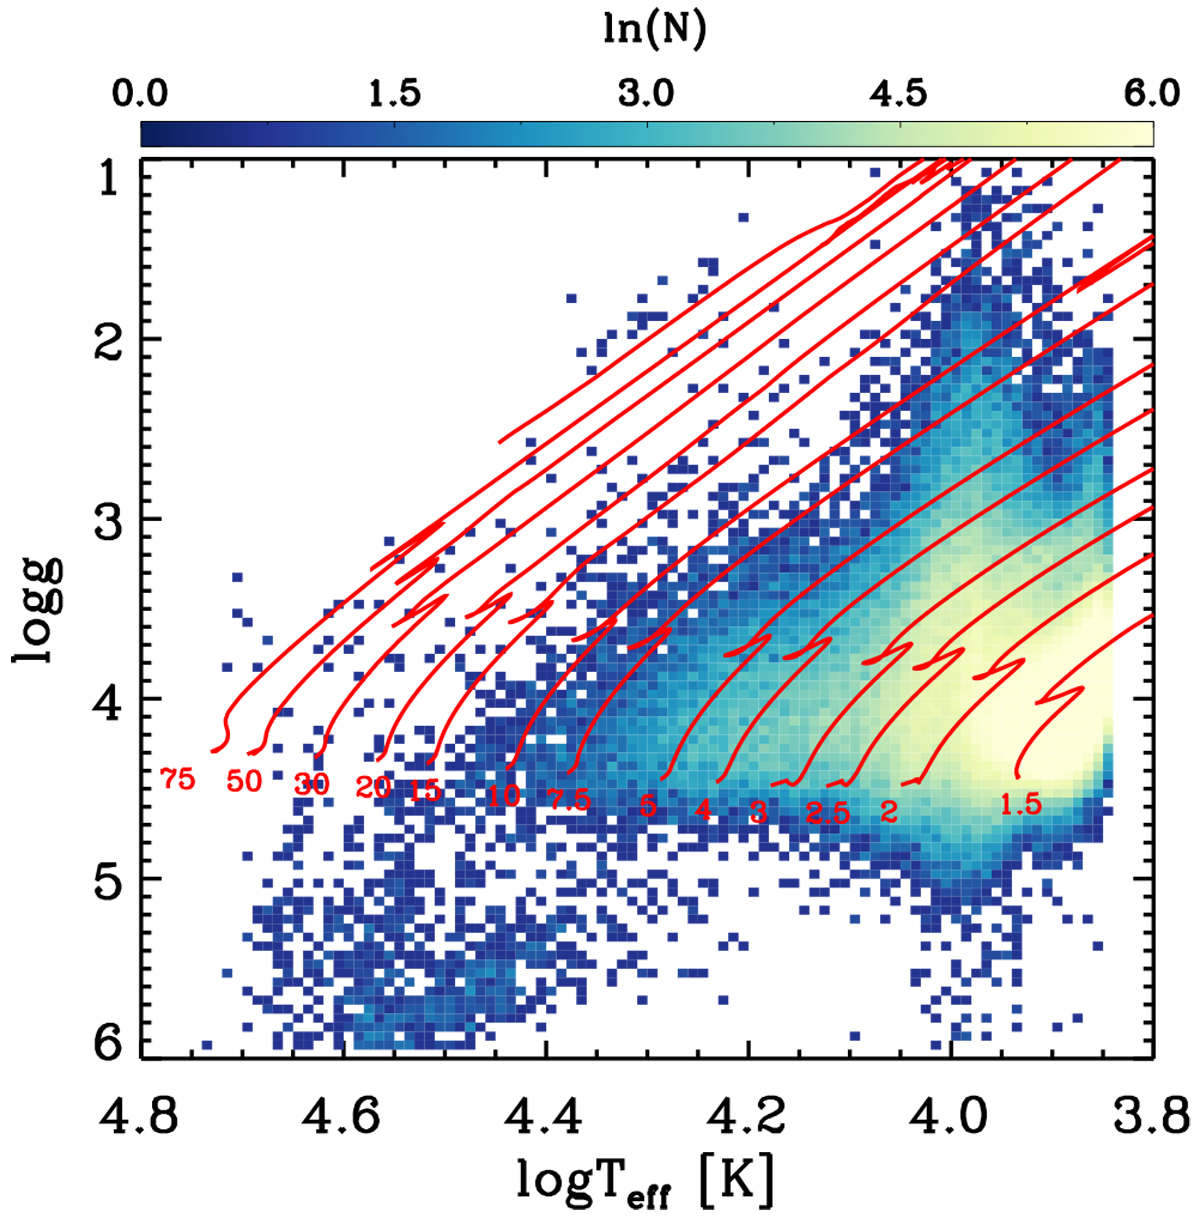
Stellar number density distribution in the Kiel (Teff–log g) diagram. Only 211 245 stars with S /N > 30 are shown. Also shown in the figure are the MIST stellar evolution tracks (Paxton et al. 2011; Choi et al. 2016) with [Fe/H] = –0.5 and V/Vc = 0.4. The initial stellar masses of the tracks are marked (in unit of M⊙). The stars with log g > 5 and log Teff > 4.2 are hot subdwarfs. The vertical stripe at log Teff ~ 4.0 is an artifact for chemically peculiar stars (e.g., Ap/Bp stars and Am stars) whose log g have been underestimated as a consequence of masking the hydrogen lines for label determination.
Current usage metrics show cumulative count of Article Views (full-text article views including HTML views, PDF and ePub downloads, according to the available data) and Abstracts Views on Vision4Press platform.
Data correspond to usage on the plateform after 2015. The current usage metrics is available 48-96 hours after online publication and is updated daily on week days.
Initial download of the metrics may take a while.