Fig. 10
Download original image
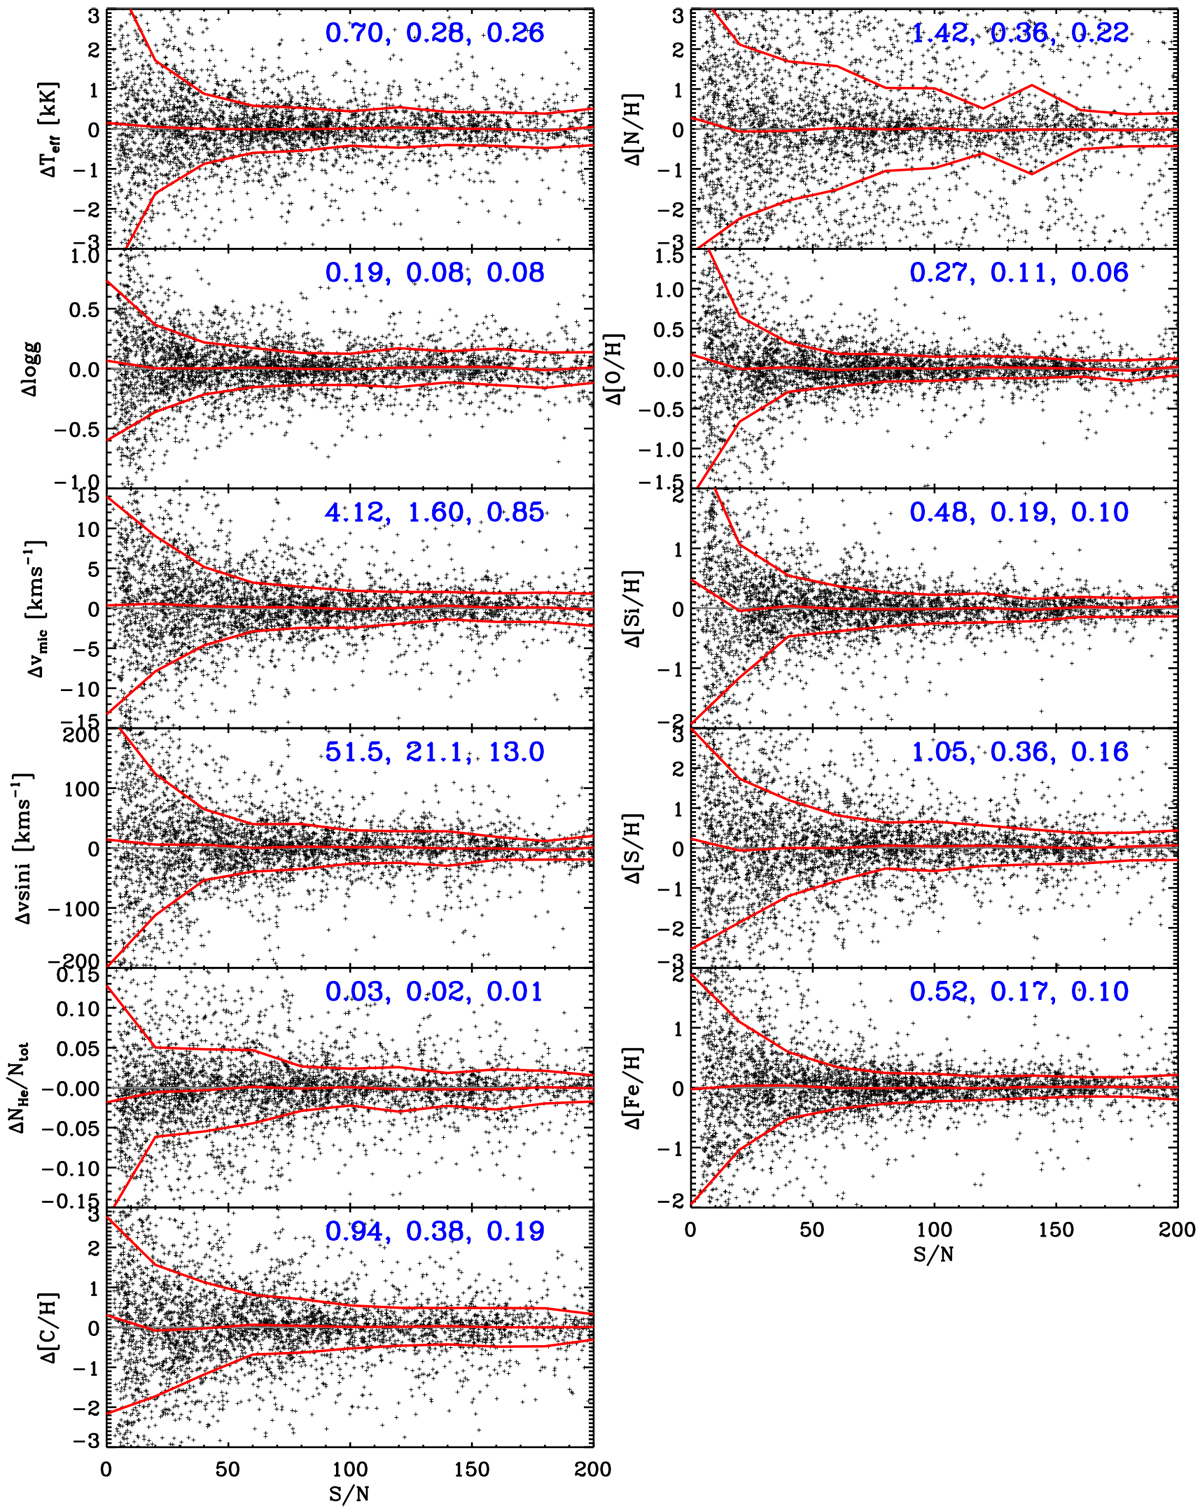
Label differences between repeat observations as a function of S/N for stars with Teff > 10 000 K. Only repeat observations carried out on different observation nights and with S/N differences of less than 20 percent are adopted. The x axis shows the mean S/N of the repeat observations. The solid lines in red show the median differences as well as the standard deviations at different S/N. The numbers marked in the figure are precision (the scatter divided by ![]() , i.e., assuming both stars contribute equally) for stars with S /N < 50, 50 < S/N < 100, and S /N > 100, respectively.
, i.e., assuming both stars contribute equally) for stars with S /N < 50, 50 < S/N < 100, and S /N > 100, respectively.
Current usage metrics show cumulative count of Article Views (full-text article views including HTML views, PDF and ePub downloads, according to the available data) and Abstracts Views on Vision4Press platform.
Data correspond to usage on the plateform after 2015. The current usage metrics is available 48-96 hours after online publication and is updated daily on week days.
Initial download of the metrics may take a while.