Fig. 1
Download original image
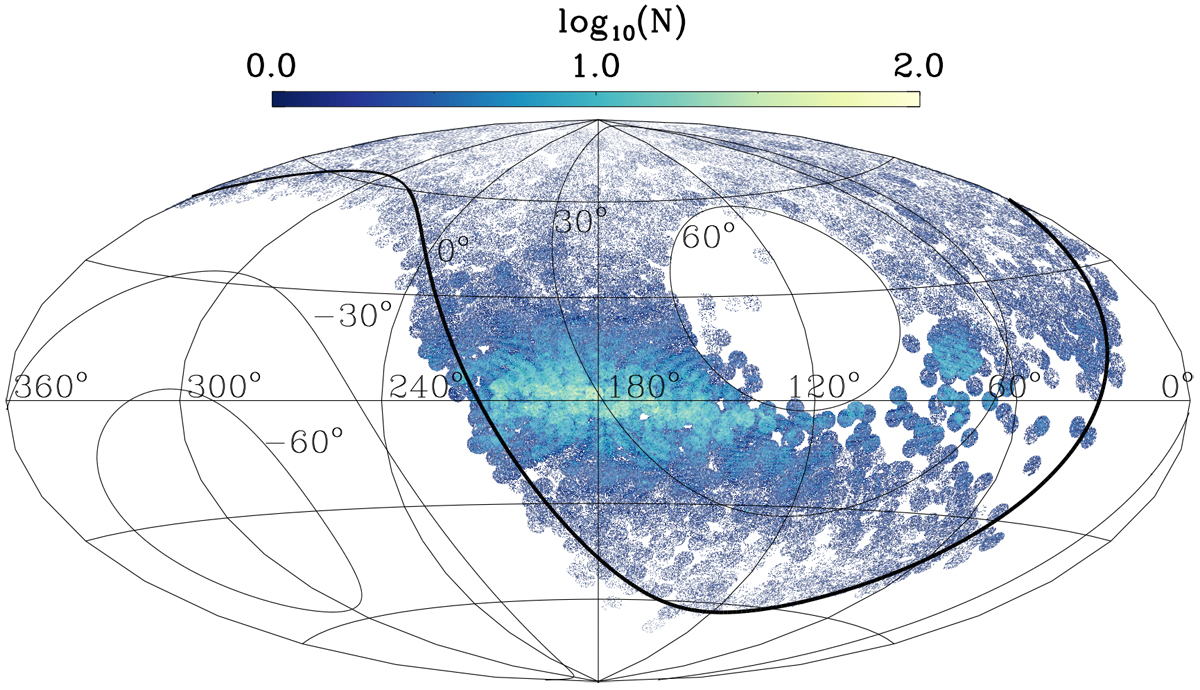
On-sky distribution of our LAMOST DR6 hot-star candidates in Galactic coordinates (l, b). The map is centered on the Galactic anticenter (l = 180°, b = 0°). The thick line delineates the celestial equator (Dec = 0°), and lines of constant declination, Dec = ±30° and Dec = ±60°, are also shown. Colors indicate the logarithmic number of stars in each (l, b) cell of 0.2° × 0.2°. The distribution reflects both the LAMOST survey area and the candidate stars’ concentration to the Galactic plane, which is expected for young stars.
Current usage metrics show cumulative count of Article Views (full-text article views including HTML views, PDF and ePub downloads, according to the available data) and Abstracts Views on Vision4Press platform.
Data correspond to usage on the plateform after 2015. The current usage metrics is available 48-96 hours after online publication and is updated daily on week days.
Initial download of the metrics may take a while.