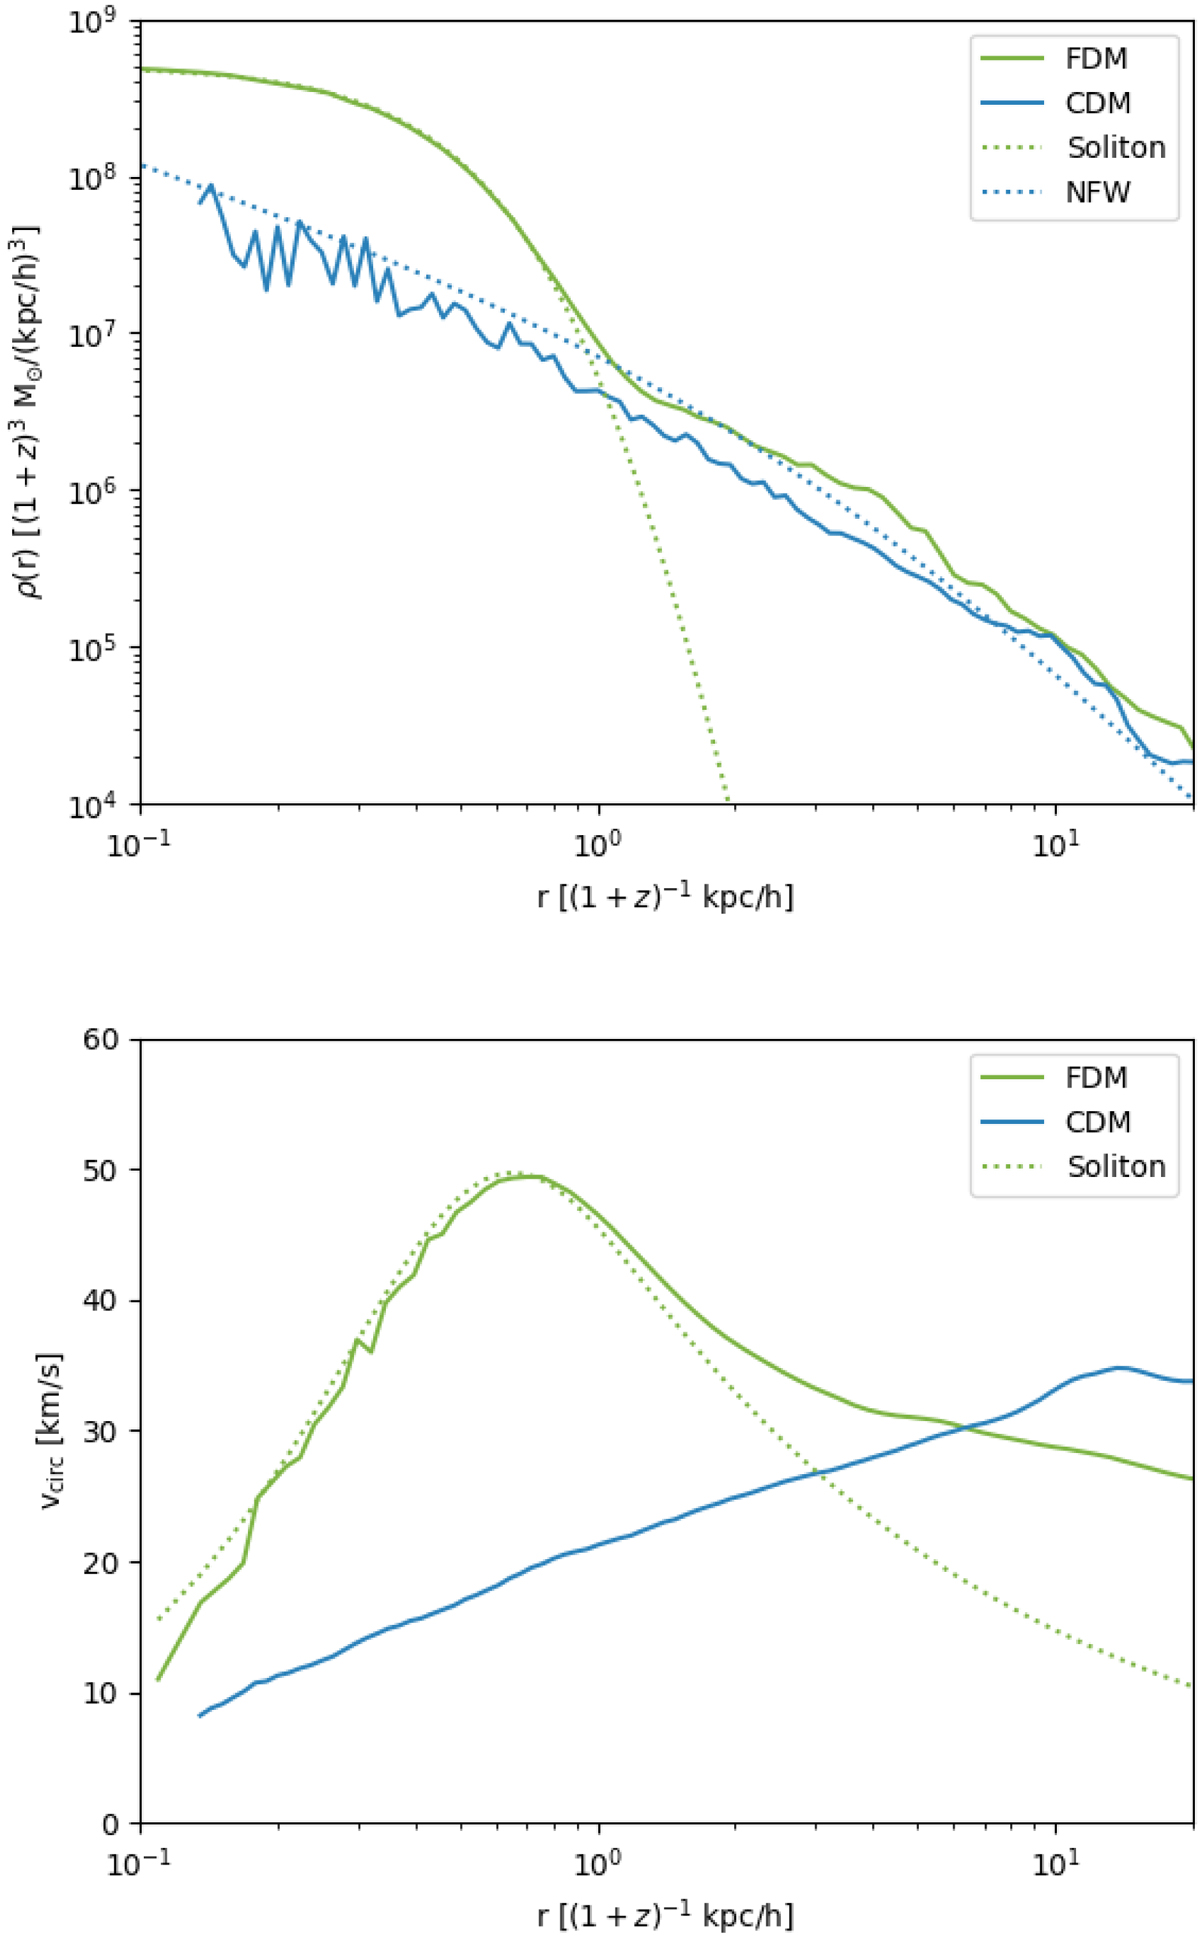
Fig. 4.
Download original image
Density (upper panel) and circular velocity (bottom panel) profiles of HALO 2 at redshift z = 2.5. The solid lines show the FDM (green) and the CDM (blue) haloes. While the dotted green line represents result of the fit of the solitonic core found in the FDM halo, the dotted blue line represents the result of the NFW fit of the CDM halo.
Current usage metrics show cumulative count of Article Views (full-text article views including HTML views, PDF and ePub downloads, according to the available data) and Abstracts Views on Vision4Press platform.
Data correspond to usage on the plateform after 2015. The current usage metrics is available 48-96 hours after online publication and is updated daily on week days.
Initial download of the metrics may take a while.