Fig. 5
Download original image
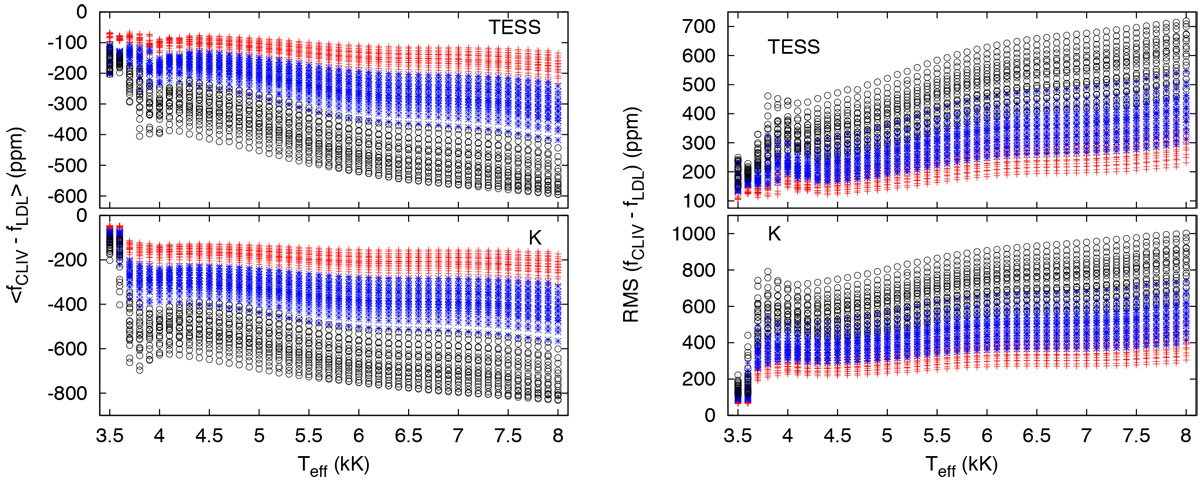
The differences between synthetic planetary transit light curve as a function of stellar effective temperature for different transit inclinations. Left: average differences between synthetic planetary transit light curves computed using model stellar atmosphere CLIV or best-fit quadratric limb-darkening laws as a function of effective temperature for the TESS band (top) and K band (bottom). Right: same as the left panels, but for the RMS of the light curves. The red crosses represent transits with μ0 = 1, blue stars those with μ0 = 0.7, and black open squares those with μ0 = 0.3. The spread of the average differences and RMS values for each μ0 arises from variations in stellar mass and gravity for a given stellar effective temperature.
Current usage metrics show cumulative count of Article Views (full-text article views including HTML views, PDF and ePub downloads, according to the available data) and Abstracts Views on Vision4Press platform.
Data correspond to usage on the plateform after 2015. The current usage metrics is available 48-96 hours after online publication and is updated daily on week days.
Initial download of the metrics may take a while.