Fig. 1
Download original image
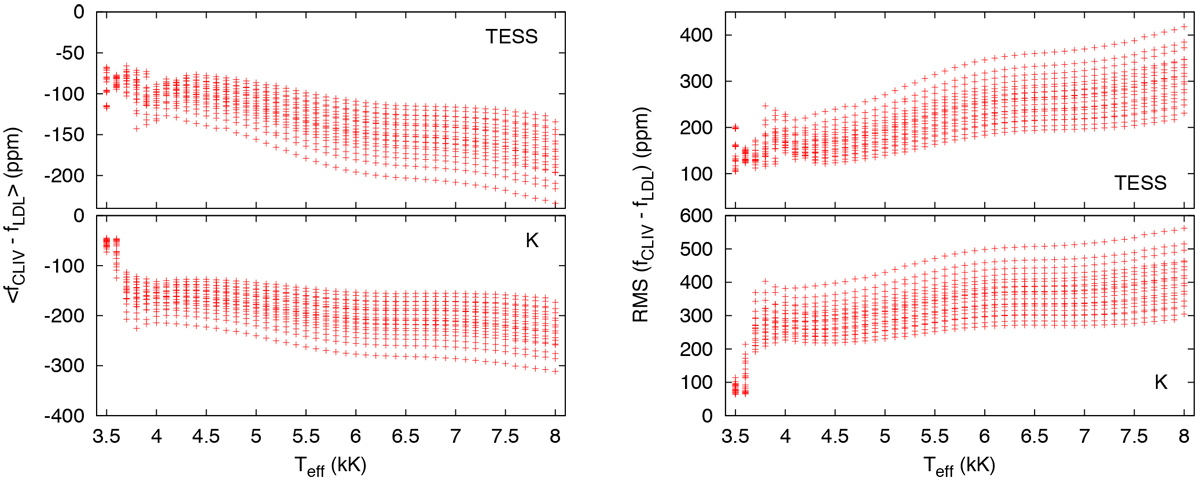
A comparison of predicted planetary transit light curves as a function of stellar effective temperature. Left: average differences between synthetic planetary transit light curves computed using model stellar atmosphere CLIV and using best-fit quadratric limb-darkening laws as a function of effective temperature for the TESS band (top) and K band (bottom). Right: same as the left panels, but for the RMS difference of the light curves. For each effective temperature bin, there are models computed for four different gravities and five different masses.
Current usage metrics show cumulative count of Article Views (full-text article views including HTML views, PDF and ePub downloads, according to the available data) and Abstracts Views on Vision4Press platform.
Data correspond to usage on the plateform after 2015. The current usage metrics is available 48-96 hours after online publication and is updated daily on week days.
Initial download of the metrics may take a while.