Fig. 3.
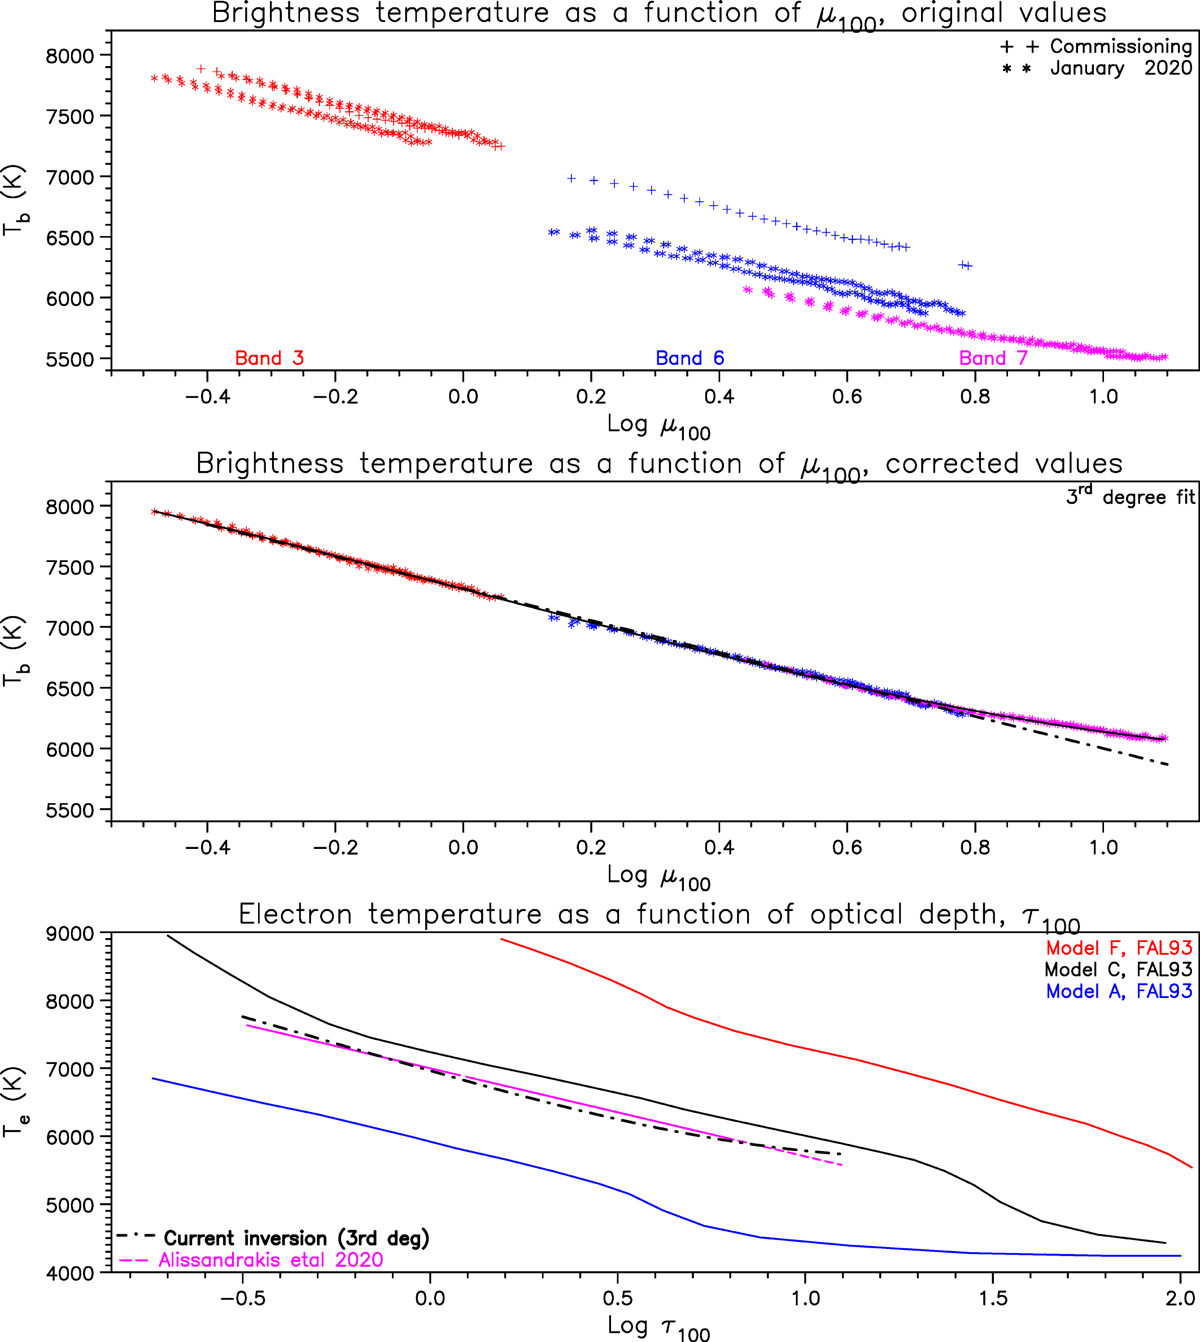
Download original image
CLV observations and their inversion. Top row: measured brightness temperature as a function of reference μ, for commissioning data and from the current data set. Middle row: normalized data set. The solid line shows a third degree fit and the dash-dotted line shows a linear fit up to log μ100 = 0.8. Bottom row: electron temperature as a function of the reference optical depth, deduced from the inversion of the observations. Model curves from Fontenla et al. (1993) and our results from Paper II are also plotted.
Current usage metrics show cumulative count of Article Views (full-text article views including HTML views, PDF and ePub downloads, according to the available data) and Abstracts Views on Vision4Press platform.
Data correspond to usage on the plateform after 2015. The current usage metrics is available 48-96 hours after online publication and is updated daily on week days.
Initial download of the metrics may take a while.