Open Access
Fig. 6.
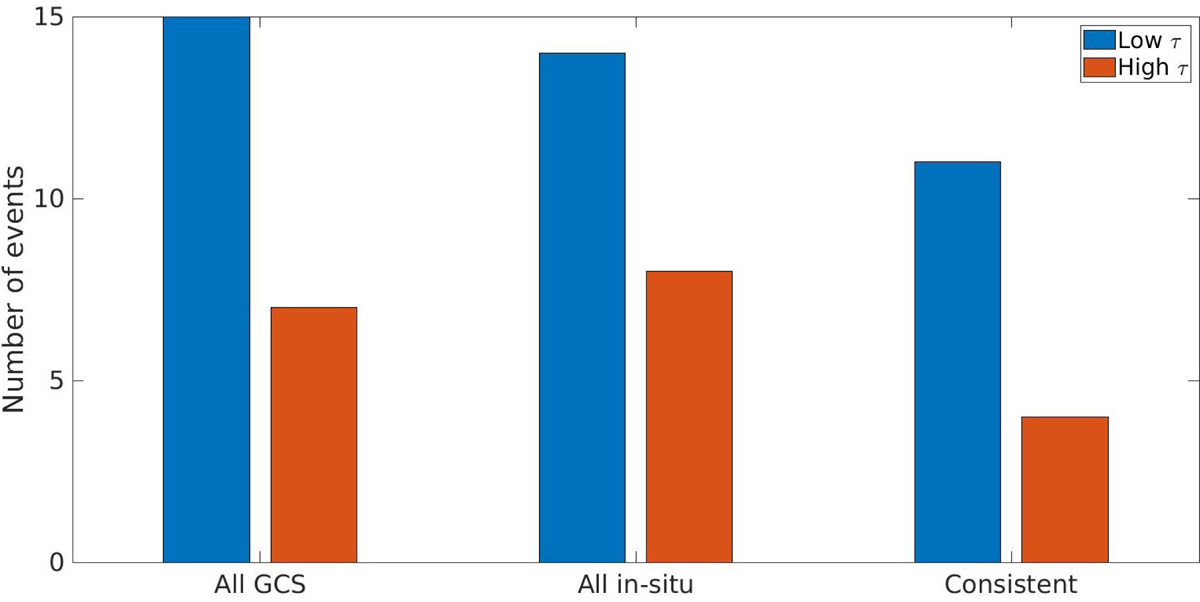
Download original image
Depiction of how many high and low inclination events were observed using the GCS model in the near-Sun environment, how many high and low inclination events were observed using in situ data in the near-Earth environment, and how many consistent events were classified as low and high inclination.
Current usage metrics show cumulative count of Article Views (full-text article views including HTML views, PDF and ePub downloads, according to the available data) and Abstracts Views on Vision4Press platform.
Data correspond to usage on the plateform after 2015. The current usage metrics is available 48-96 hours after online publication and is updated daily on week days.
Initial download of the metrics may take a while.