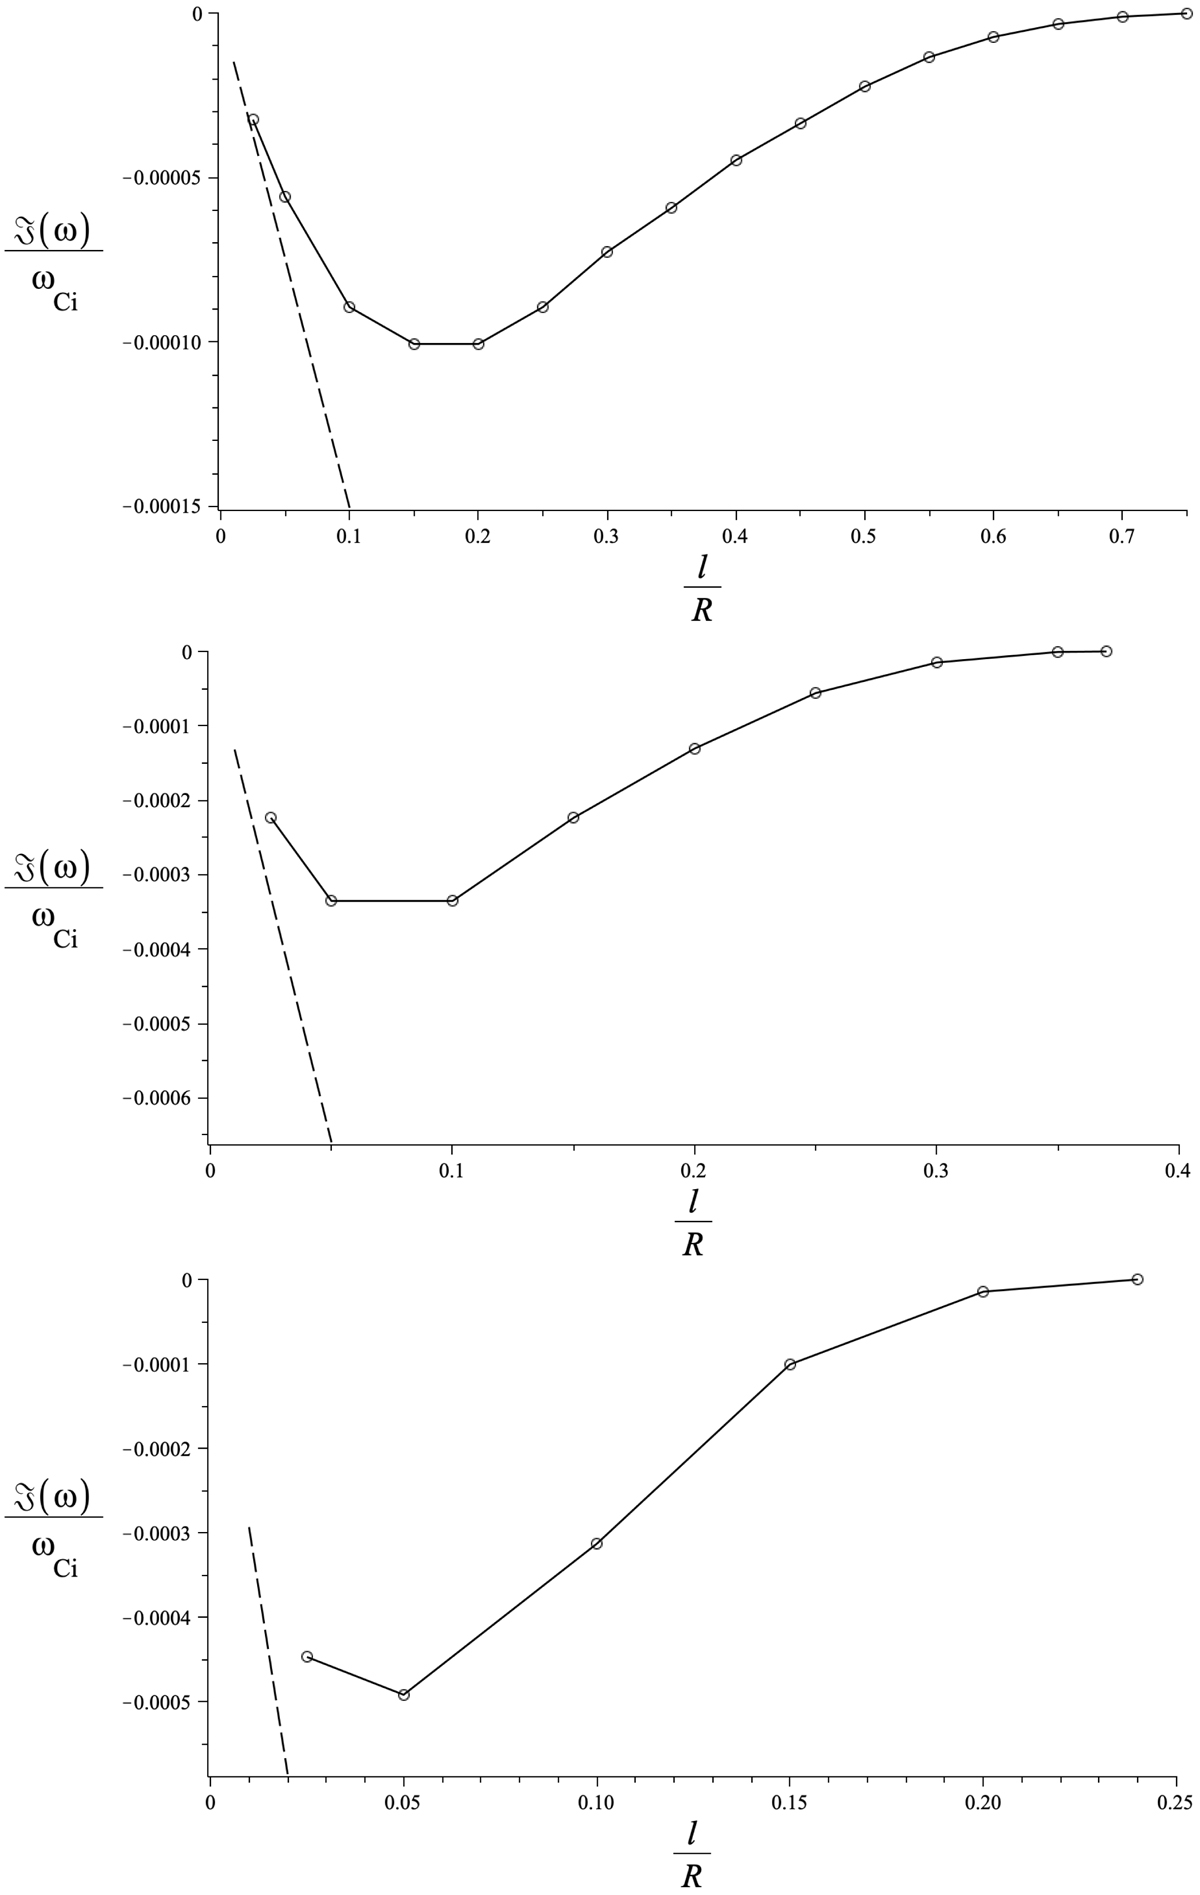
Fig. 4.
Download original image
Imaginary part of the frequency of the slow sausage quasimode (solid line) as a function of l/R for kzR = 1 (top), kzR = 3 (middle), and kzR = 5 (bottom) calculated from the dispersion relation obtained through the series method outlined in the previous sections. The modes represented here are the same as those from Fig. 3. The dashed line is the imaginary part of the frequency of the slow sausage quasimode calculated with the thin boundary approximation (42).
Current usage metrics show cumulative count of Article Views (full-text article views including HTML views, PDF and ePub downloads, according to the available data) and Abstracts Views on Vision4Press platform.
Data correspond to usage on the plateform after 2015. The current usage metrics is available 48-96 hours after online publication and is updated daily on week days.
Initial download of the metrics may take a while.