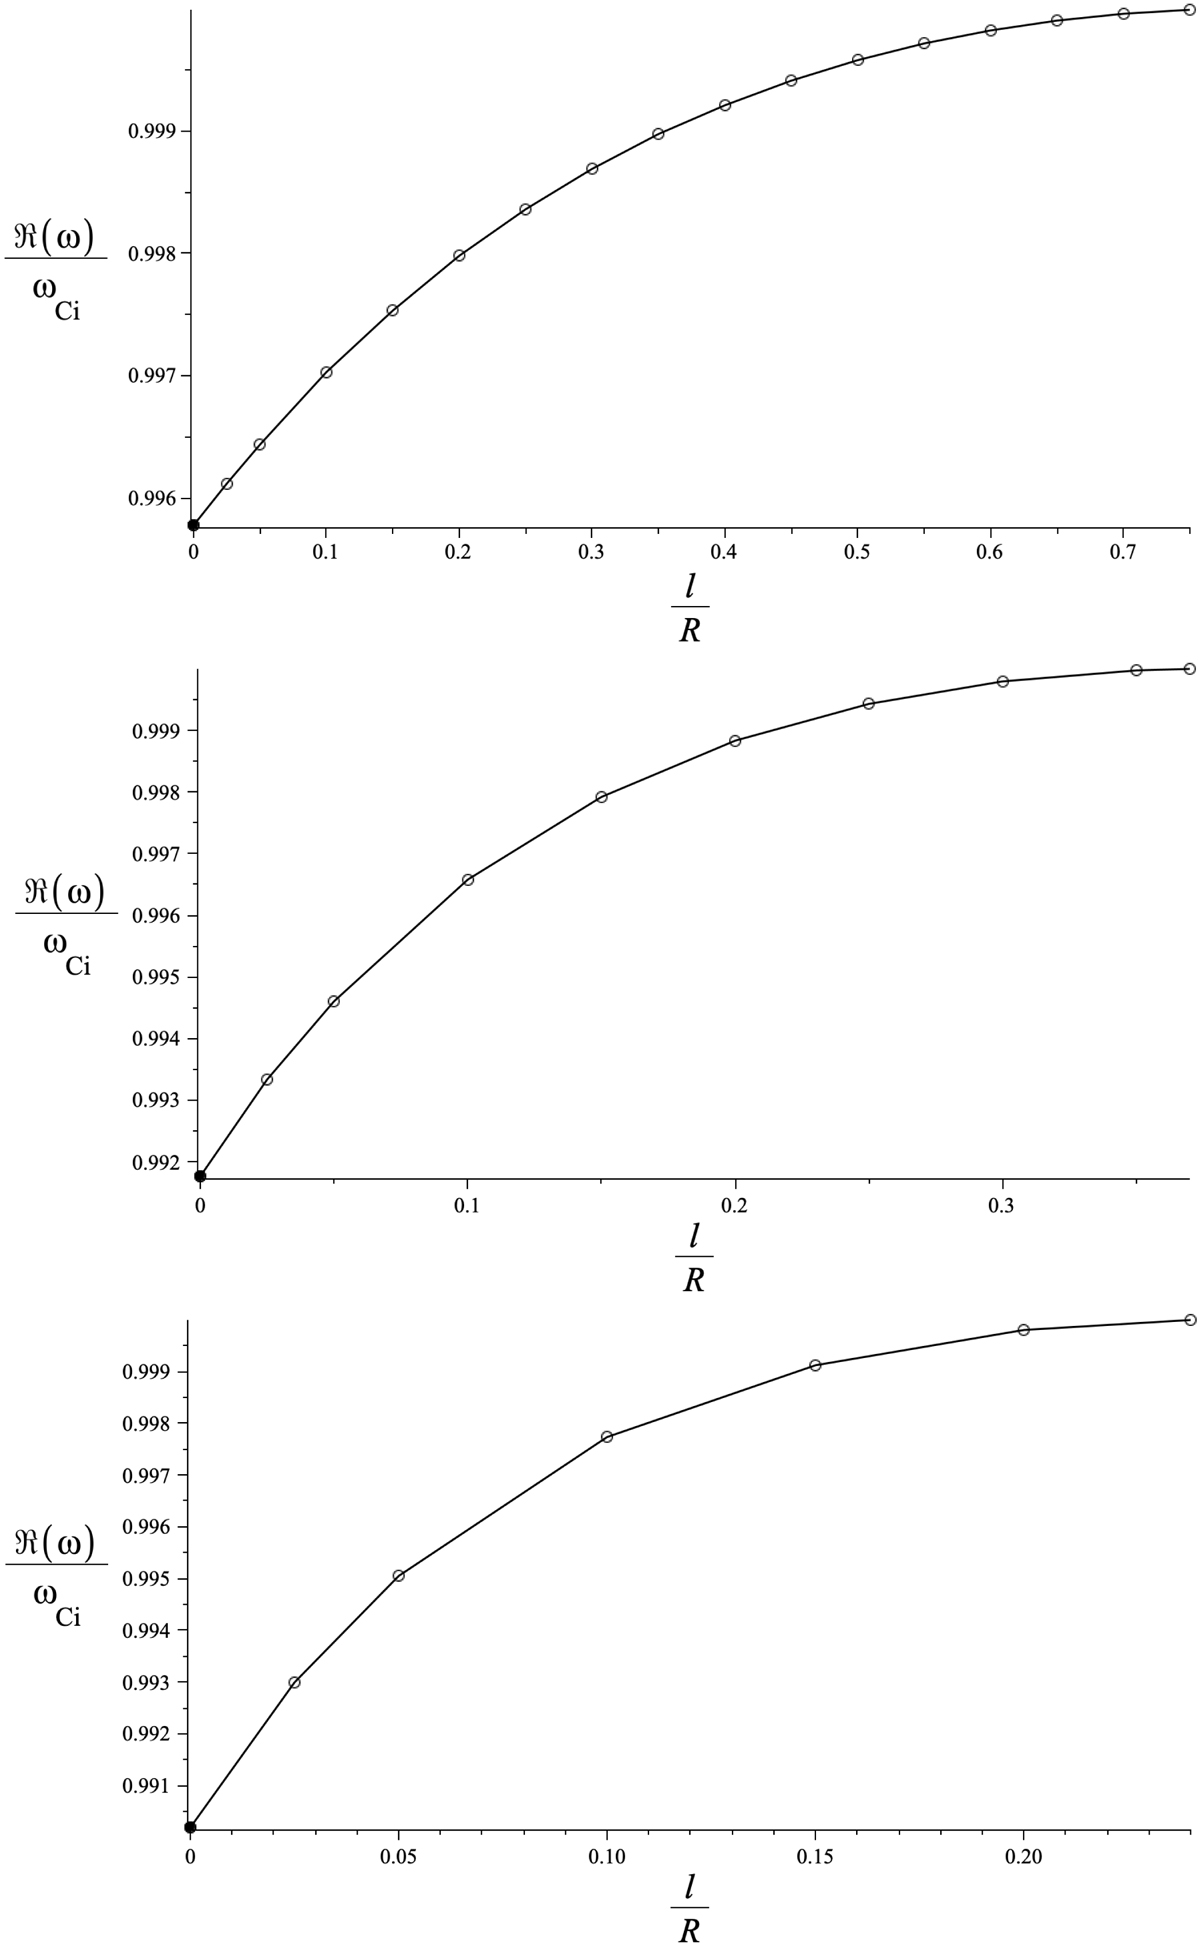
Fig. 3.

Download original image
Real part of the frequency of the slow sausage quasimode (solid line) as a function of l/R for kzR = 1 (top), kzR = 3 (middle), and kzR = 5 (bottom). The hollow circles represent the quasimode, with the frequency calculated from the dispersion relation obtained through the series method outlined in the previous sections. The full circle is the frequency of the slow surface sausage mode in the case of a discontinuous boundary, calculated from the dispersion relation in Edwin & Roberts (1983) under the same physical conditions.
Current usage metrics show cumulative count of Article Views (full-text article views including HTML views, PDF and ePub downloads, according to the available data) and Abstracts Views on Vision4Press platform.
Data correspond to usage on the plateform after 2015. The current usage metrics is available 48-96 hours after online publication and is updated daily on week days.
Initial download of the metrics may take a while.


