Open Access
Fig. 6.
Download original image
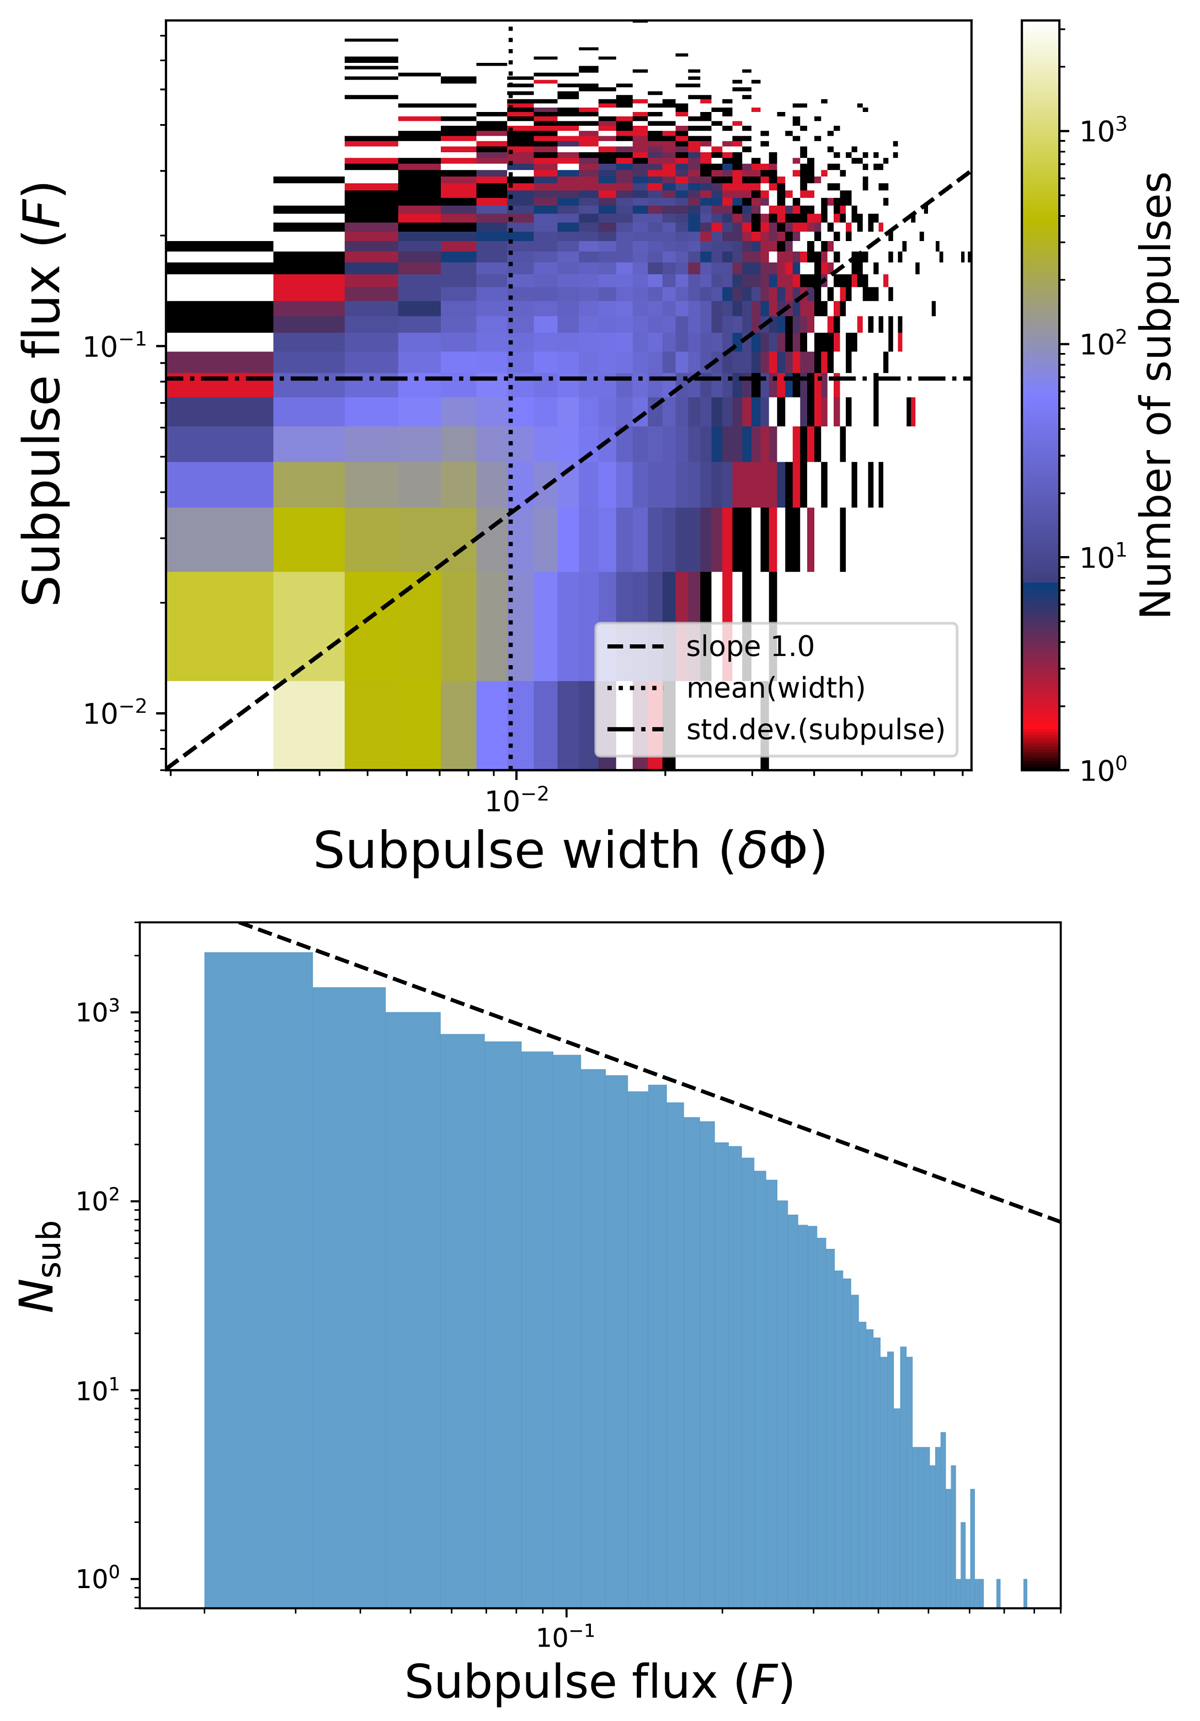
Demographics of all synchrotron subpulses in the simulation dataset. Top: subpulse width in phase (δΦ) and maximum flux with respect to the mean profile (F) distributions. The dashed oblique line is F ∝ δΦ. Bottom: subpulse flux distribution. The black dashed line shows Nsub ∝ F−1.
Current usage metrics show cumulative count of Article Views (full-text article views including HTML views, PDF and ePub downloads, according to the available data) and Abstracts Views on Vision4Press platform.
Data correspond to usage on the plateform after 2015. The current usage metrics is available 48-96 hours after online publication and is updated daily on week days.
Initial download of the metrics may take a while.